Bitcoin Struggles Below $70,000 as Market Fear Persists
We may earn commissions from affiliate links or include sponsored content, clearly labeled as such. These partnerships do not influence our editorial independence or the accuracy of our reporting. By continuing to use the site you agree to our terms and conditions and privacy policy.


The total crypto market cap sits at $2.37 trillion as the Fear and Greed Index hits 25. Bitcoin, Ethereum, and XRP face consolidation after recent volatility.
The total capitalization of digital assets has declined to approximately $2.37 trillion, while the Fear and Greed Index remains stuck in the “Fear” zone (25). This signal suggests the market narrative stays cautious despite the stabilization of several leading tokens.
Bitcoin Holds Below $70,000
Bitcoin (BTC) is currently trading around $69,500 after failing to sustain momentum from a brief spike above $71,000 earlier this week.
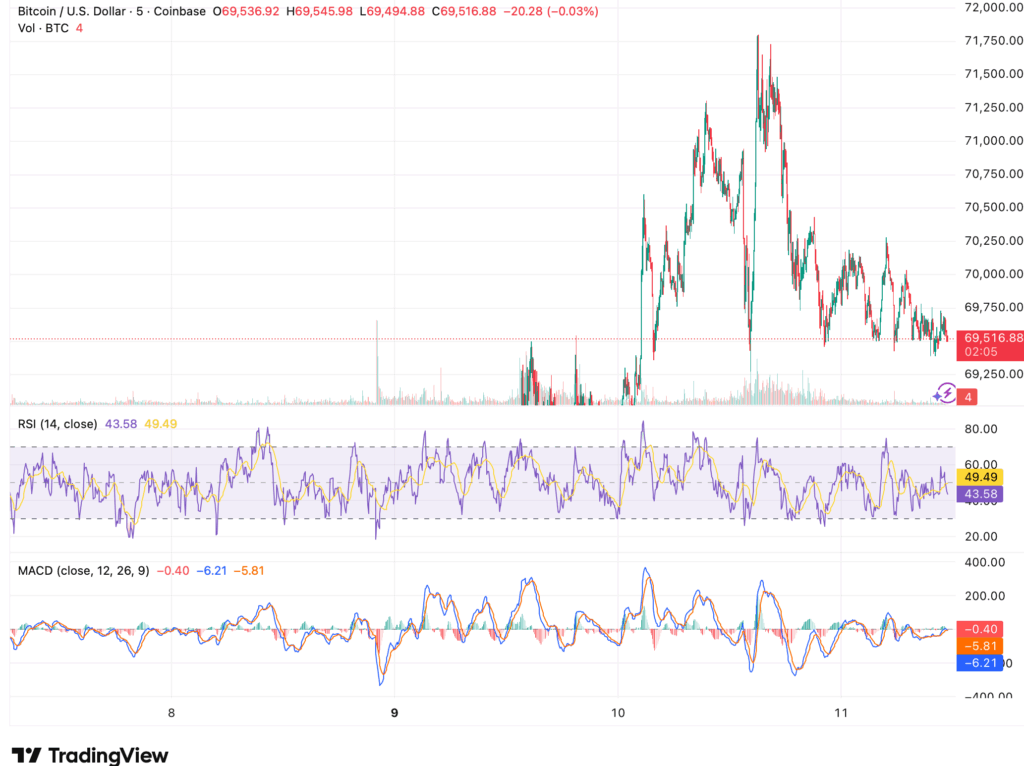
Data reveals that the price is consolidating within a tight range between $69,000 and $70,000, pointing toward a wait-and-see approach among traders.
Technical indicators also reflect neutral momentum. The Relative Strength Index (RSI) is hovering between 43 and 49, signaling the absence of a strong trend, while the MACD remains close to the neutral line. For many analysts, this represents a typical consolidation phase following the strong price movements seen in recent days.
Bitcoin ETF Performance
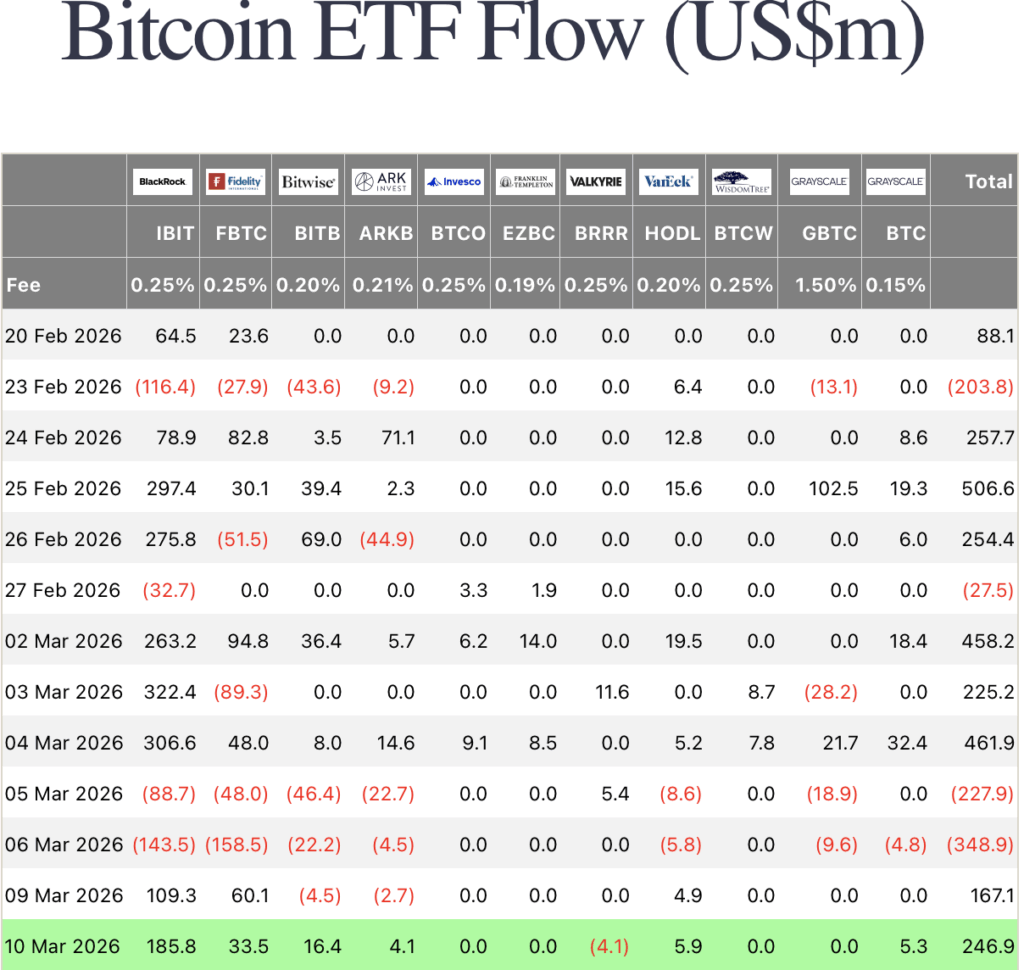
Spot Bitcoin ETFs recorded their second consecutive day of solid inflows. On March 10, total net inflows reached $246 million. BlackRock’s IBIT led the pack with a significant $185 million in additions, followed by Fidelity’s FBTC with $33.5 million.
Ethereum Stabilizes Near $2,000
Ethereum (ETH) is trading close to $2,025 after experiencing sharp volatility earlier in the week. Despite a brief climb above $2,080, the price quickly returned to the $2,000–$2,050 range, indicating that the market is still searching for a clear direction.
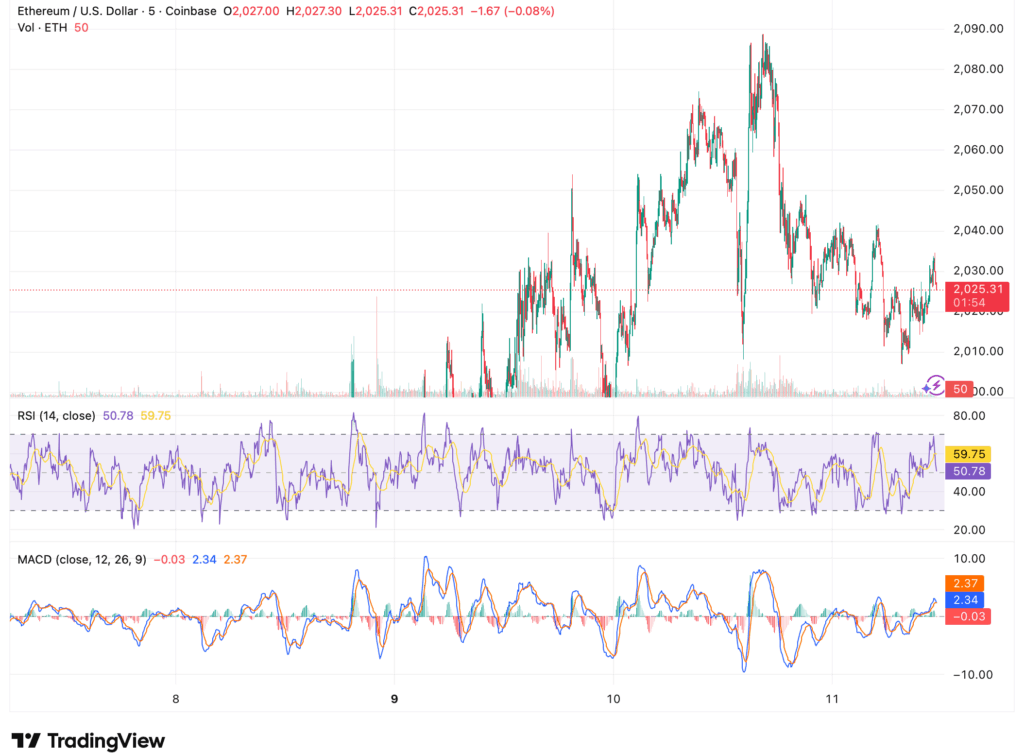
The RSI for Ethereum is moving between 50 and 59, suggesting a more balanced demand between buyers and sellers. Meanwhile, the MACD is beginning a slight upward crossover, which some traders interpret as a potential signal for a short-term recovery.
XRP Loses Momentum After Recent Rally
XRP is trading at approximately $1.37, having failed to maintain levels above $1.43 reached earlier this week. Following a sharp rally, the price has entered a period of consolidation as the market appears to be absorbing gains from the previous move higher.
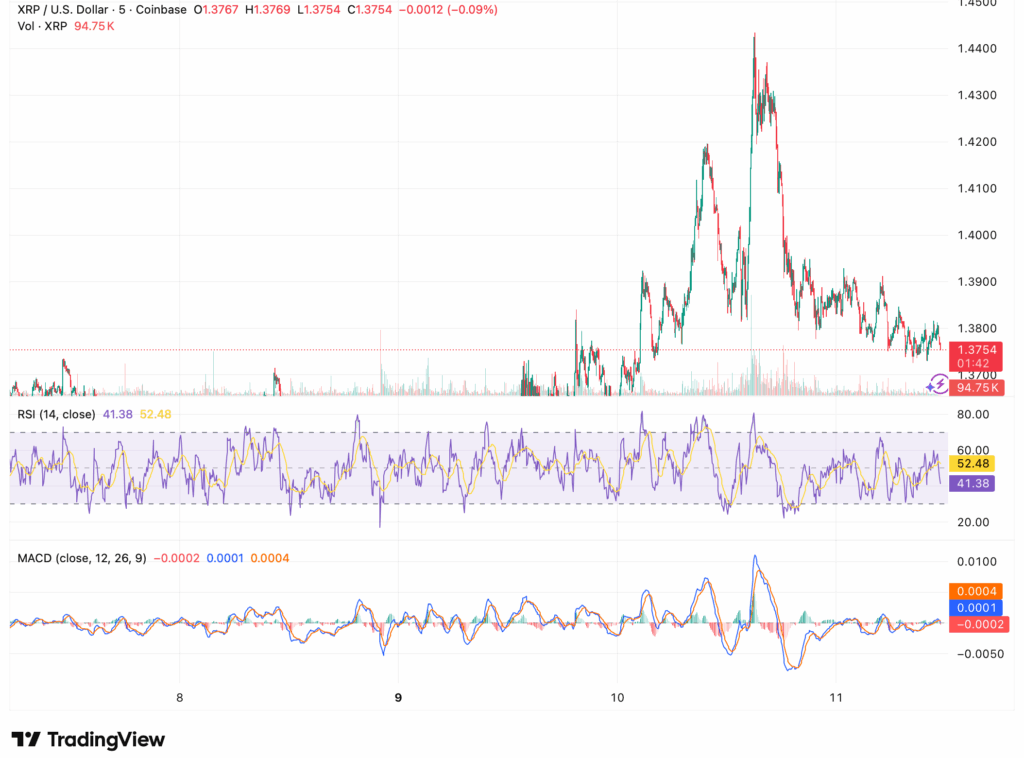
Indicators show a moderate cooling of momentum. The RSI remains between 41 and 52, while the MACD is drifting near zero, suggesting a lack of a strong short-term trend.
Key Factors Investors Are Watching
The broader crypto market remains sensitive to macroeconomic factors and the movements of global financial markets. Analysts view Bitcoin’s stabilization around $69,000 as a critical level for the short-term trend, as a breakout above $70,000 could restore bullish momentum.
At the same time, investors are closely monitoring market liquidity and the activity of large holders (whales), who have recently increased their exposure to long positions in Bitcoin and Ethereum. This behavior is often viewed as an early signal of a potentially stronger move if market sentiment begins to improve.
For those interested in platforms that allow trading without mandatory identity verification, you can explore the analysis of the best no-KYC crypto exchanges in 2026. The report identifies which platforms offer a combination of liquidity, security, and data protection for crypto traders.


Fill in necessary fields and publish