Bitcoin’s August Performance: Historic Gains and Painful Losses
We may earn commissions from affiliate links or include sponsored content, clearly labeled as such. These partnerships do not influence our editorial independence or the accuracy of our reporting. By continuing to use the site you agree to our terms and conditions and privacy policy.


August presents a paradox for Bitcoin investors. On one hand, it has historically delivered some of the most impressive post-halving gains.
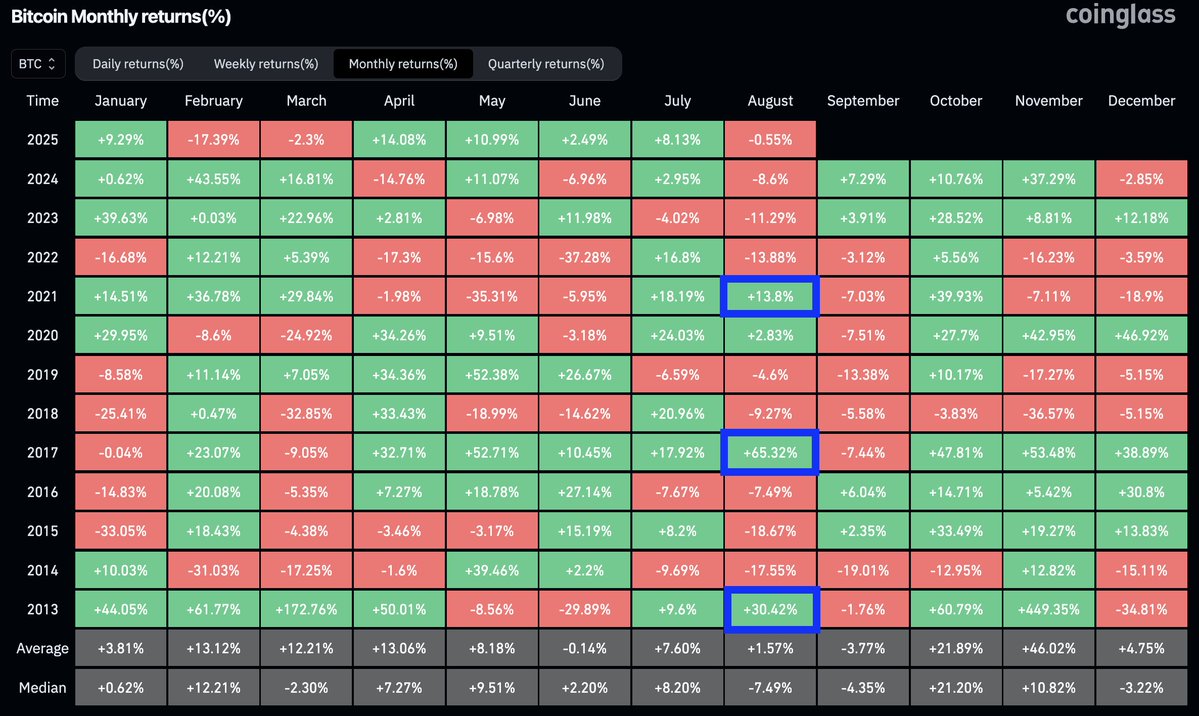
In 2013, Bitcoin surged +30.42%. In 2017, it rallied +65.32%. Even in the choppy cycle of 2021, it still managed a +13.8% return during August—making it the best-performing month in each of those post-halving years.
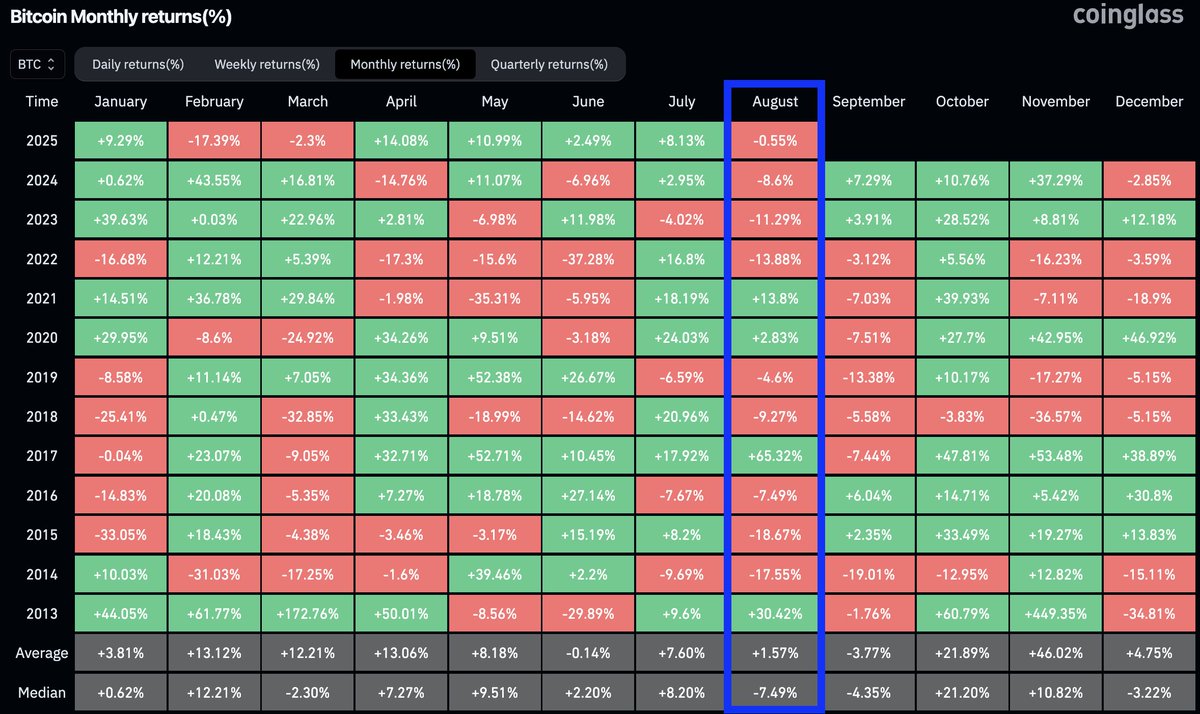
But zooming out, August tells a different story. According to Coinglass data, it ranks among the worst-performing months for Bitcoin across broader market cycles. The average August return over the past decade is just +1.57%, while the median is actually –7.49%, reflecting a recurring tendency for mid-Q3 weakness. 2022 and 2023, for instance, saw double-digit losses in August.
So far in 2025, the trend remains uncertain. Bitcoin entered the month with mild momentum, posting an 8.13% gain in July. But August opened slightly negative at –0.55%, putting bulls on edge. If this cycle follows the historical post-halving script, a sharp rebound may still be possible—yet the conflicting broader seasonal pattern warrants caution.
The question now: will August 2025 repeat history’s upside magic, or fall into the trap of seasonal weakness?
Read More:
What Comes Next?
While past halving cycles suggest strong upside potential in August, the Reserve Risk signal and increased MVOCDD readings urge caution. If history repeats, this could be the setup for a short-term top, followed by a consolidation period.
Investors should watch how Bitcoin reacts around key psychological levels like $110K–$115K. A failure to break higher despite bullish seasonal expectations could validate the on-chain warning.
Ultimately, this August may reveal which pattern prevails—the macro-cycle strength of post-halving years or the precision of on-chain metrics like Reserve Risk.


Fill in necessary fields and publish