Bitcoin Monthly Pattern: Analyst Notes Key First-Week Price Trends
We may earn commissions from affiliate links or include sponsored content, clearly labeled as such. These partnerships do not influence our editorial independence or the accuracy of our reporting. By continuing to use the site you agree to our terms and conditions and privacy policy.


Crypto analyst Daan Crypto Trades highlighted a recurring pattern in Bitcoin’s price action: the cryptocurrency often sets its monthly high or low within the first 15 days.
According to his analysis, this has occurred in 100% of the months across Bitcoin’s last four years of trading history.
Early-Month Highs and Lows
The observation suggests that traders should pay particular attention to Bitcoin’s price behavior during the opening days of each month. When narrowing the timeframe further, Daan found that 51% of months see highs or lows established in just the first six days.
In practice, the pattern often plays out with Bitcoin setting a local top or bottom in the first week, followed by a reversal and a trending move throughout the remainder of the month. While not guaranteed, this dynamic has provided reliable signals in recent cycles.
Exceptions and Recent Shifts
The streak has been consistent for much of the past 18 months. However, Daan noted that the last two months broke the trend, as Bitcoin traded sideways without establishing decisive early highs or lows. He added that the pattern has been less reliable in 2025 compared to 2024, but remains a useful guide for monitoring potential turning points.
Explaining the Chart
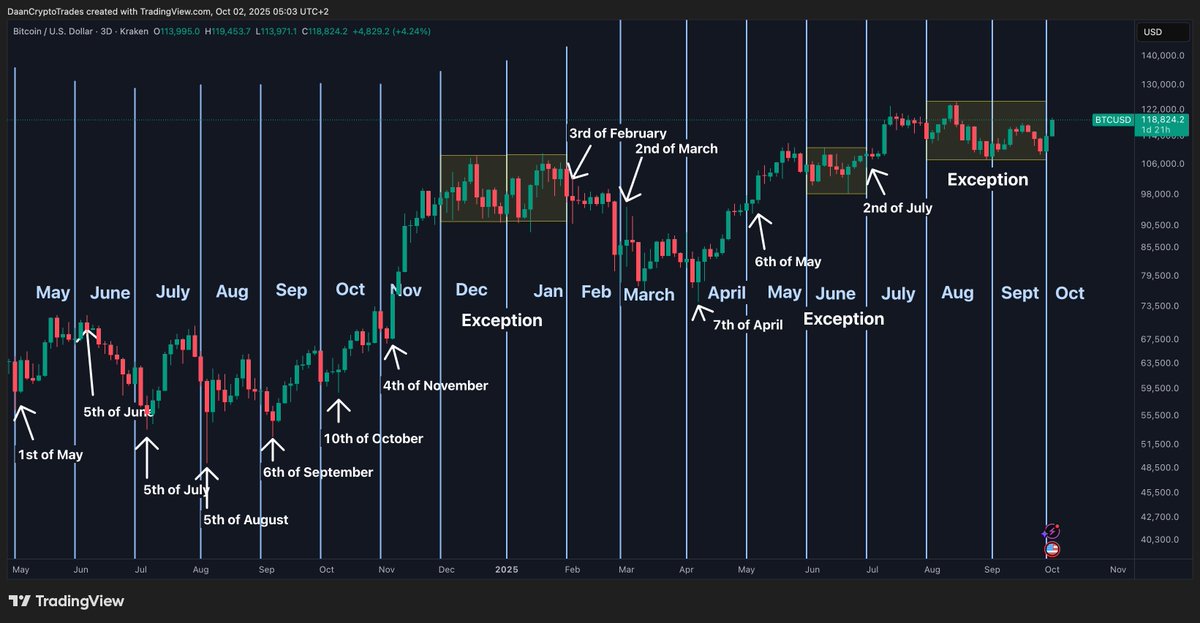
The accompanying chart plots Bitcoin’s price candles against monthly divisions, with arrows marking when highs or lows were set. For example, May 1, June 5, July 5, and August 5 were all dates when Bitcoin quickly defined its monthly extremes. Other months like November 4, February 3, and April 7 followed the same rhythm.
There are noted “exceptions,” such as December 2024 and September 2025, when the pattern did not materialize, underlining that the trend is statistical rather than absolute. Still, the visual demonstrates how frequently the first few trading sessions steer the entire month’s trajectory.

Why It Matters for Traders
Even though the pattern has softened recently, analysts argue it can still serve as a short-term trading framework. If Bitcoin sets a sharp high early in the month, traders may anticipate potential downside moves in subsequent weeks, and vice versa.
With Bitcoin currently trading around $118,800, the first week of October may once again prove decisive in shaping the broader trend. As Daan emphasized, while patterns aren’t guarantees, they provide valuable context and statistical edges in a market where sentiment often shifts quickly.


Fill in necessary fields and publish