Bitcoin and Business Cycles: Are we Entering a Parabolic Phase?
We may earn commissions from affiliate links or include sponsored content, clearly labeled as such. These partnerships do not influence our editorial independence or the accuracy of our reporting. By continuing to use the site you agree to our terms and conditions and privacy policy.


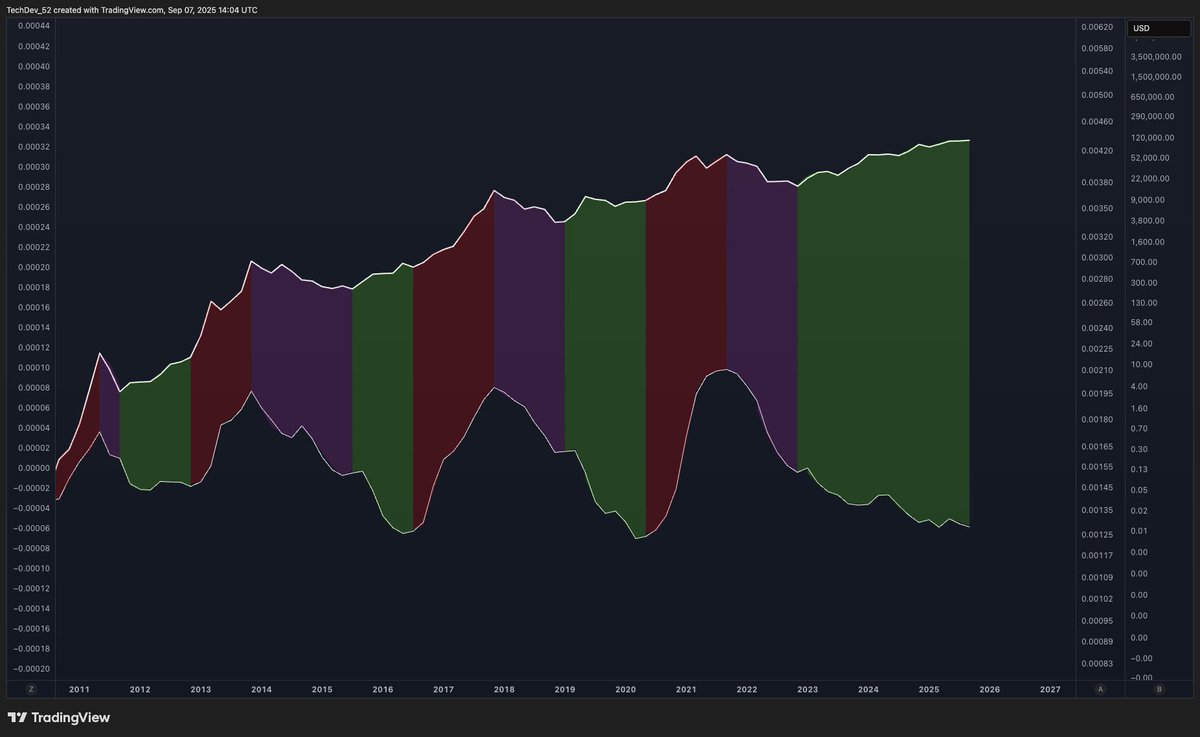
Analyst TechDev has shared a visualization comparing Bitcoin’s price cycles with broader business cycle (BC) trends.
The chart uses color-coded phases to highlight how Bitcoin historically aligns with economic peaks and reversals.
- Red (Top): Marks business cycle peaks, often coinciding with Bitcoin’s own blow-off tops.
- Purple (Bear market): When both BC and Bitcoin fall together, signaling prolonged downside.
- Green (Bull ramp): Bitcoin grinds higher while BC continues to fall, showing BTC’s resilience.
- Red again (Bull parabola): BC reverses upward, moving in tandem with Bitcoin to drive exponential rallies.
Where we are now
The current section of the chart shows Bitcoin moving within a green “bull ramp” zone, where BTC has been steadily rising even as the business cycle weakens. Historically, this stage often precedes Bitcoin’s strongest parabolic advances. If the business cycle soon flips into recovery, the chart suggests BTC could transition into the red “bull parabola” zone — the phase where both economic expansion and Bitcoin price growth feed off each other.

Why it matters
This cyclical framework is significant because it connects macroeconomic momentum with Bitcoin’s unique four-year halving rhythm. Past instances of the “bull ramp” phase have served as launchpads into Bitcoin’s most explosive price growth, leading directly into new all-time highs.
The big question
TechDev ends with a simple but weighty question: “Where are we now?” The answer depends on whether Bitcoin maintains its grind higher until the business cycle turns positive. If history repeats, the next reversal could align with Bitcoin’s long-awaited parabolic breakout.


Fill in necessary fields and publish