Ethereum Enters a New Market Regime as ETF Exposure Expands
We may earn commissions from affiliate links or include sponsored content, clearly labeled as such. These partnerships do not influence our editorial independence or the accuracy of our reporting. By continuing to use the site you agree to our terms and conditions and privacy policy.


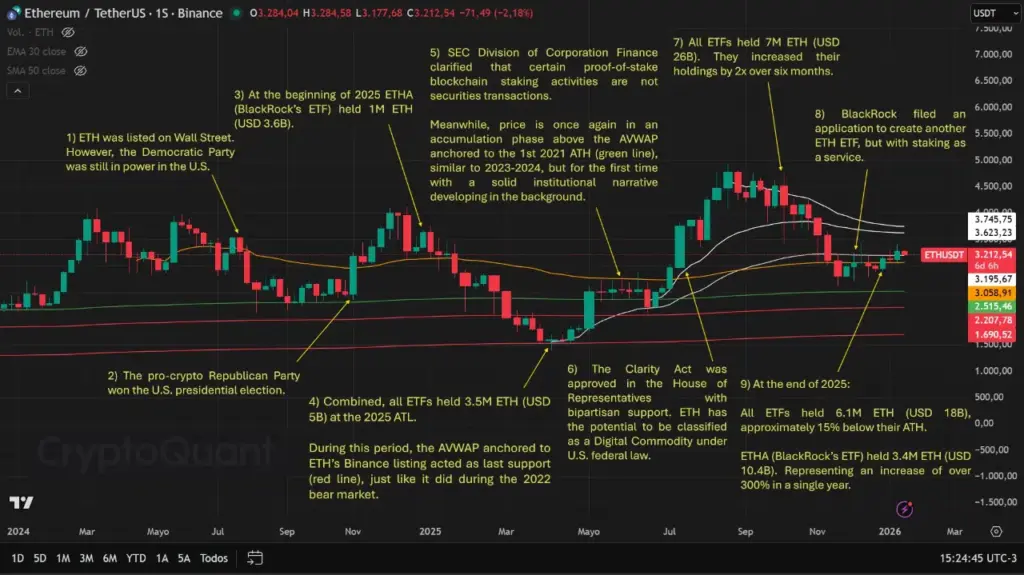
Rather than telling a simple story of price ups and downs, Ethereum’s weekly chart over the past cycle reads like a timeline of how institutional capital gradually entered, retreated, and then reasserted itself.
Price action, regulatory signals, and fund positioning evolved together, turning the chart into a map of structural change rather than short-term speculation.
At the time of writing, Ethereum is trading near $3,100, with a market capitalization of roughly $374 billion and circulating supply close to 120.7 million ETH.
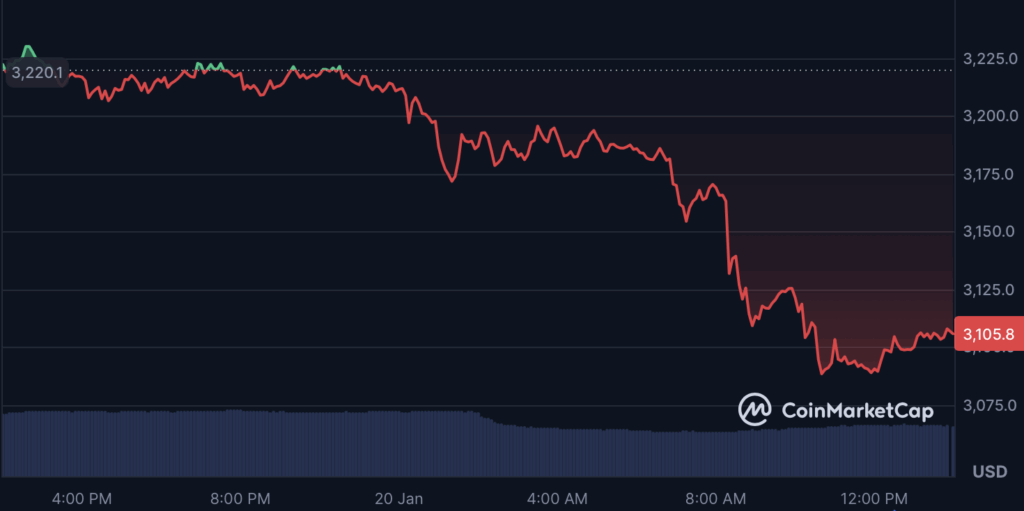
Those figures sit at the tail end of a multi-year transition that reshaped how ETH trades.
From Open Access to Indecision
Ethereum’s early exposure to traditional markets did not immediately translate into strong institutional demand. Although the asset became accessible through regulated channels, price spent extended periods oscillating within wide ranges.
Weekly candles lacked persistence, reflecting hesitation rather than accumulation. Capital flows were light, and ETH largely traded as a high-beta risk asset without a clear long-term sponsor.
This stage laid the groundwork: a liquid market, but one still driven mostly by short-term positioning rather than strategic allocation.
The 2025 Bottom as a Structural Reset
The cycle changed meaningfully at the 2025 low. ETF exposure had contracted to around 3.5 million ETH, valued near $5 billion, signaling reduced but stabilizing institutional presence. At the same time, price compressed into a long-term support zone defined by the anchored volume-weighted average price linked to Ethereum’s Binance-era liquidity.
That level had already proven decisive during the 2022 bear market. Its defense in 2025 suggested exhaustion on the downside rather than renewed distribution. Price stopped falling not because demand exploded, but because selling pressure ran out at a structurally important zone.
Regulation Turns Into a Catalyst
Momentum returned once regulatory uncertainty eased. In early 2025, BlackRock’s ETHA fund crossed the one-million ETH mark, while U.S. regulators clarified that certain proof-of-stake staking activities did not constitute securities transactions. That combination mattered.
Ethereum reclaimed its long-term VWAP and began building higher weekly closes, this time supported by expanding ETF balances rather than speculative bursts. The market’s character shifted: price started responding to capital allocation cycles instead of headline-driven volatility.
ETFs Redefine Late-Cycle Behavior
The final phase saw institutional exposure accelerate. Combined ETF holdings briefly reached seven million ETH, worth about $26 billion, before cooling to around 6.1 million ETH by year-end. Even after the pullback, exposure remained dramatically higher than earlier in the cycle. ETHA alone held approximately 3.4 million ETH, valued near $10.4 billion, more than triple its holdings from a year earlier.
Price advanced, corrected, and consolidated, but the structure held. Weekly pullbacks looked more like rebalancing than capitulation, reinforcing the idea that Ethereum had entered a market regime shaped by institutional flows.
In compressed form, the chart shows a clear evolution: Ethereum moved from open access without commitment, through a structurally defended bottom, into a phase where regulation and ETFs began to anchor demand. Today’s price near $3,100 reflects not just speculation, but a market increasingly governed by long-term positioning and institutional participation.
Read our full guide to the best crypto airdrops for this year.


Fill in necessary fields and publish