Bitcoin Climbs Back Above $120,000: What’s Driving the Rally?
We may earn commissions from affiliate links or include sponsored content, clearly labeled as such. These partnerships do not influence our editorial independence or the accuracy of our reporting. By continuing to use the site you agree to our terms and conditions and privacy policy.


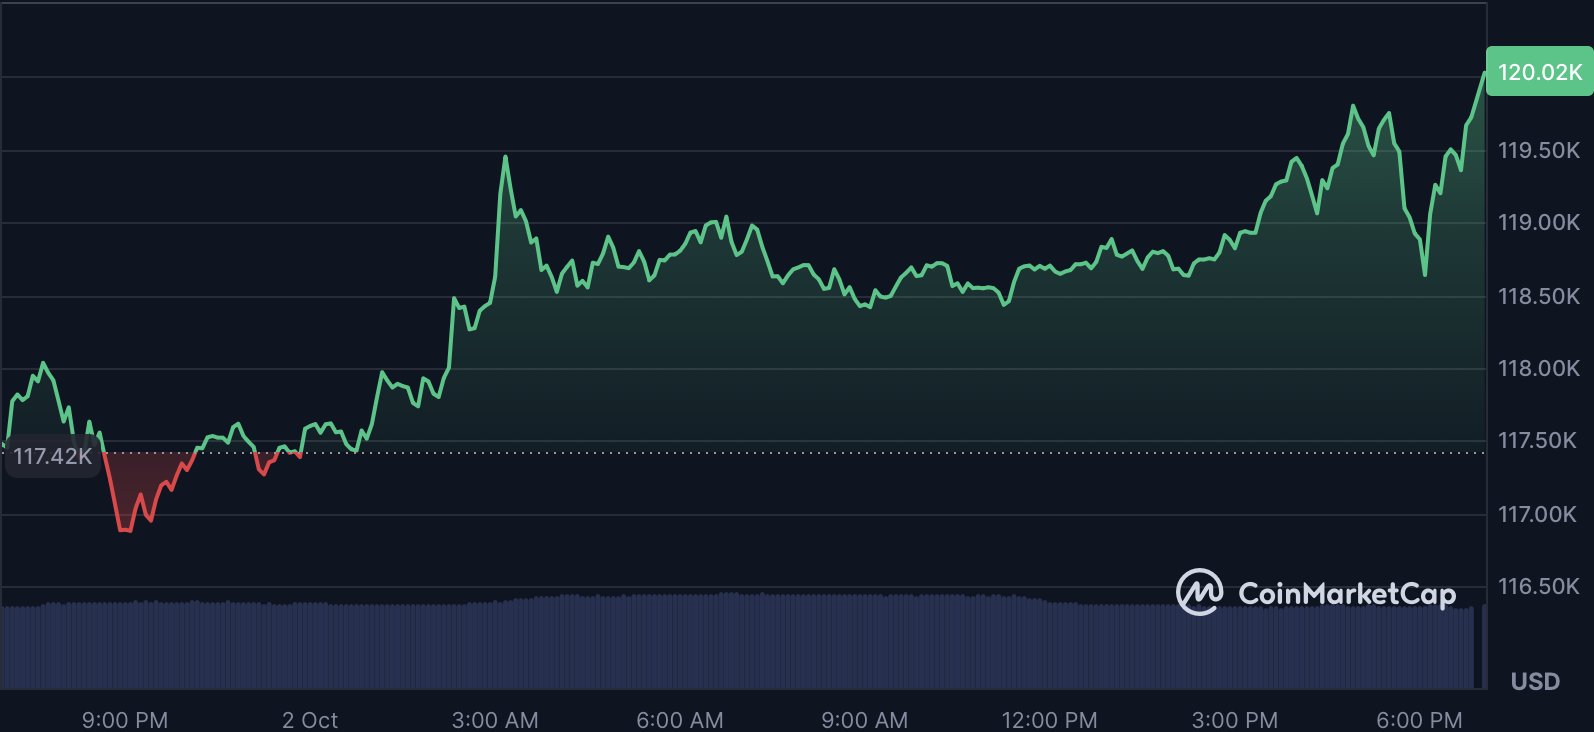
Bitcoin has surged back over the $120,000 mark, regaining bullish momentum after several weeks of sideways trading.
According to data from CoinMarketCap, BTC traded as high as $120,324 on October 2, extending its weekly gains and setting the stage for a potential technical breakout.
The move comes amid a mix of institutional inflows, macroeconomic optimism, and strong technical signals that suggest further upside may be on the horizon.
Institutional Bullishness
One of the strongest drivers behind the rally has been renewed institutional appetite. JPMorgan analysts released a report on October 2 stating Bitcoin is undervalued compared to gold, setting a target of $165,000. The bank highlighted that Bitcoin’s volatility-adjusted premium to gold has dropped to 1.85x, its lowest level since 2020.
This has coincided with fresh inflows into U.S. spot Bitcoin ETFs, which saw $676 million enter on October 1 alone, the third straight day of gains. For the week, ETF inflows totaled $1.6 billion, underlining the scale of institutional participation now supporting BTC’s rally.
Macro Market Synergy
Bitcoin’s rise is also in step with broader financial markets. The S&P 500 climbed 1.5% to 6,700 and the Nasdaq extended gains, driven largely by strength in AI-related stocks. Analysts say this reflects optimism about potential Federal Reserve rate cuts later this month, despite the ongoing U.S. government shutdown.

Even so, Bitcoin’s 24-hour correlation with the S&P 500 slipped to 0.4, suggesting the latest surge has been partly crypto-specific. Sentiment indicators reflect the shift: the Fear & Greed Index rose to 51 (Neutral) from 42 yesterday, showing a transition from caution to balanced momentum.
Technical Breakout
On the charts, Bitcoin broke decisively above the $118,648 Fibonacci swing high, supported by improving momentum indicators. The RSI(14) sits at 62.9, still in neutral territory, while the MACD histogram has risen to +319, a bullish signal.
The short-term trend is also strengthening, with the 7-day simple moving average ($112,524) crossing above the 30-day SMA ($113,486). Traders are now eyeing the next key level: the 127.2% Fibonacci extension at $121,422.
However, the 24-hour turnover ratio remains modest at 2.87%, suggesting that while momentum is strong, liquidity could amplify volatility in the near term.
Outlook
With Bitcoin back above $120,000, attention now turns to whether the rally can extend toward $124K and beyond. Institutional flows remain the dominant catalyst, but macro and technical conditions are aligning to support the bullish case.
For traders, the first week of October may prove critical in setting the tone for the rest of the month, and possibly the final quarter of the year.


Fill in necessary fields and publish