XRP Price Setup Strengthens as RSI Curvature Signals Potential Parabolic Move
We may earn commissions from affiliate links or include sponsored content, clearly labeled as such. These partnerships do not influence our editorial independence or the accuracy of our reporting. By continuing to use the site you agree to our terms and conditions and privacy policy.

XRP traders are closely watching a familiar technical pattern that has historically marked explosive rallies.
According to analyst EGRAG CRYPTO, the relative strength index (RSI) on XRP’s chart is beginning to steepen, a move that has previously preceded parabolic upside in the final phase of past cycles.
RSI curvature points to bullish potential
The setup has played out twice before in XRP’s history, each time followed by a sharp upward surge. The observation is simple: when XRP’s RSI takes on a steeper curve during late-cycle pushes, momentum tends to accelerate rapidly, leaving bears caught off guard.
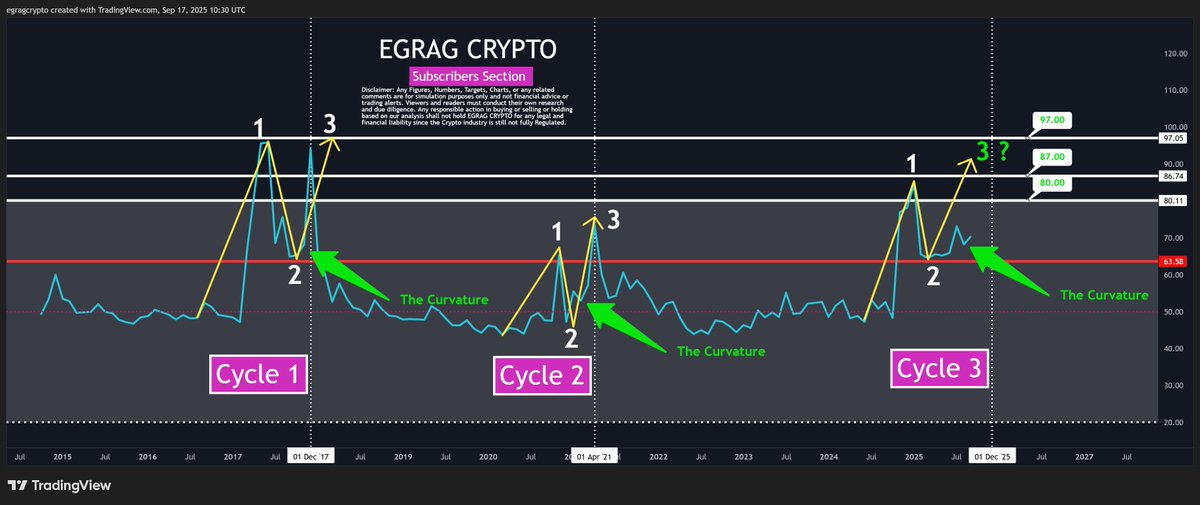
If history repeats, this shift could set the stage for another major rally. EGRAG highlighted that the RSI structure has “held true 2 out of 2 times,” fueling speculation about whether the third time will follow the same script.
Market sentiment leans bullish
While no technical indicator guarantees results, the steepening RSI has put bulls on alert. Many in the XRP community believe the current cycle could mirror prior explosive moves, especially as RSI curvature aligns with the broader bullish structure on the chart.
EGRAG himself stated that he expects XRP’s RSI to “go parabolic,” potentially leaving short sellers in a vulnerable position. This kind of sentiment reflects the growing conviction among traders that XRP may soon enter a stronger leg higher.

XRP’s cyclical context
XRP’s chart shows three distinct cycles, each with a similar RSI curvature emerging before a surge. The current cycle, marked as “Cycle 3,” has begun to exhibit the same steepening curve. If the pattern continues, XRP could be preparing for a significant breakout phase.
For now, analysts caution that confirmation will come only if XRP maintains momentum and translates RSI curvature into sustained price action. Still, the technical backdrop suggests that bulls may soon test higher resistance zones.


Fill in necessary fields and publish