


Cryptocurrency is a high-risk asset class, and investing carries significant risk, including the potential loss of some or all of your investment. The information on this website is provided for informational and educational purposes only and does not constitute financial, investment, or trading advice. For more details, please read our editorial policy.
What Technical Indicators Show About the Price of Ethereum
June 6, 2024 12:00 2 min. readWe may earn commissions from affiliate links or include sponsored content, clearly labeled as such. These partnerships do not influence our editorial independence or the accuracy of our reporting. By continuing to use the site you agree to our terms and conditions and privacy policy.

Despite the approval of the Ethereum ETF, the ETH price has remained stagnant over the past two weeks, hovering between $3,700 and $3,840.
This lack of movement raises questions about Ethereum’s impact on the market, especially when compared to the bullish trends seen in other cryptocurrencies.
However, technical factors suggest a potential rally for Ethereum in the near future. Market sentiment appears bullish, as indicated by fear and greed indices reflecting rising demand.
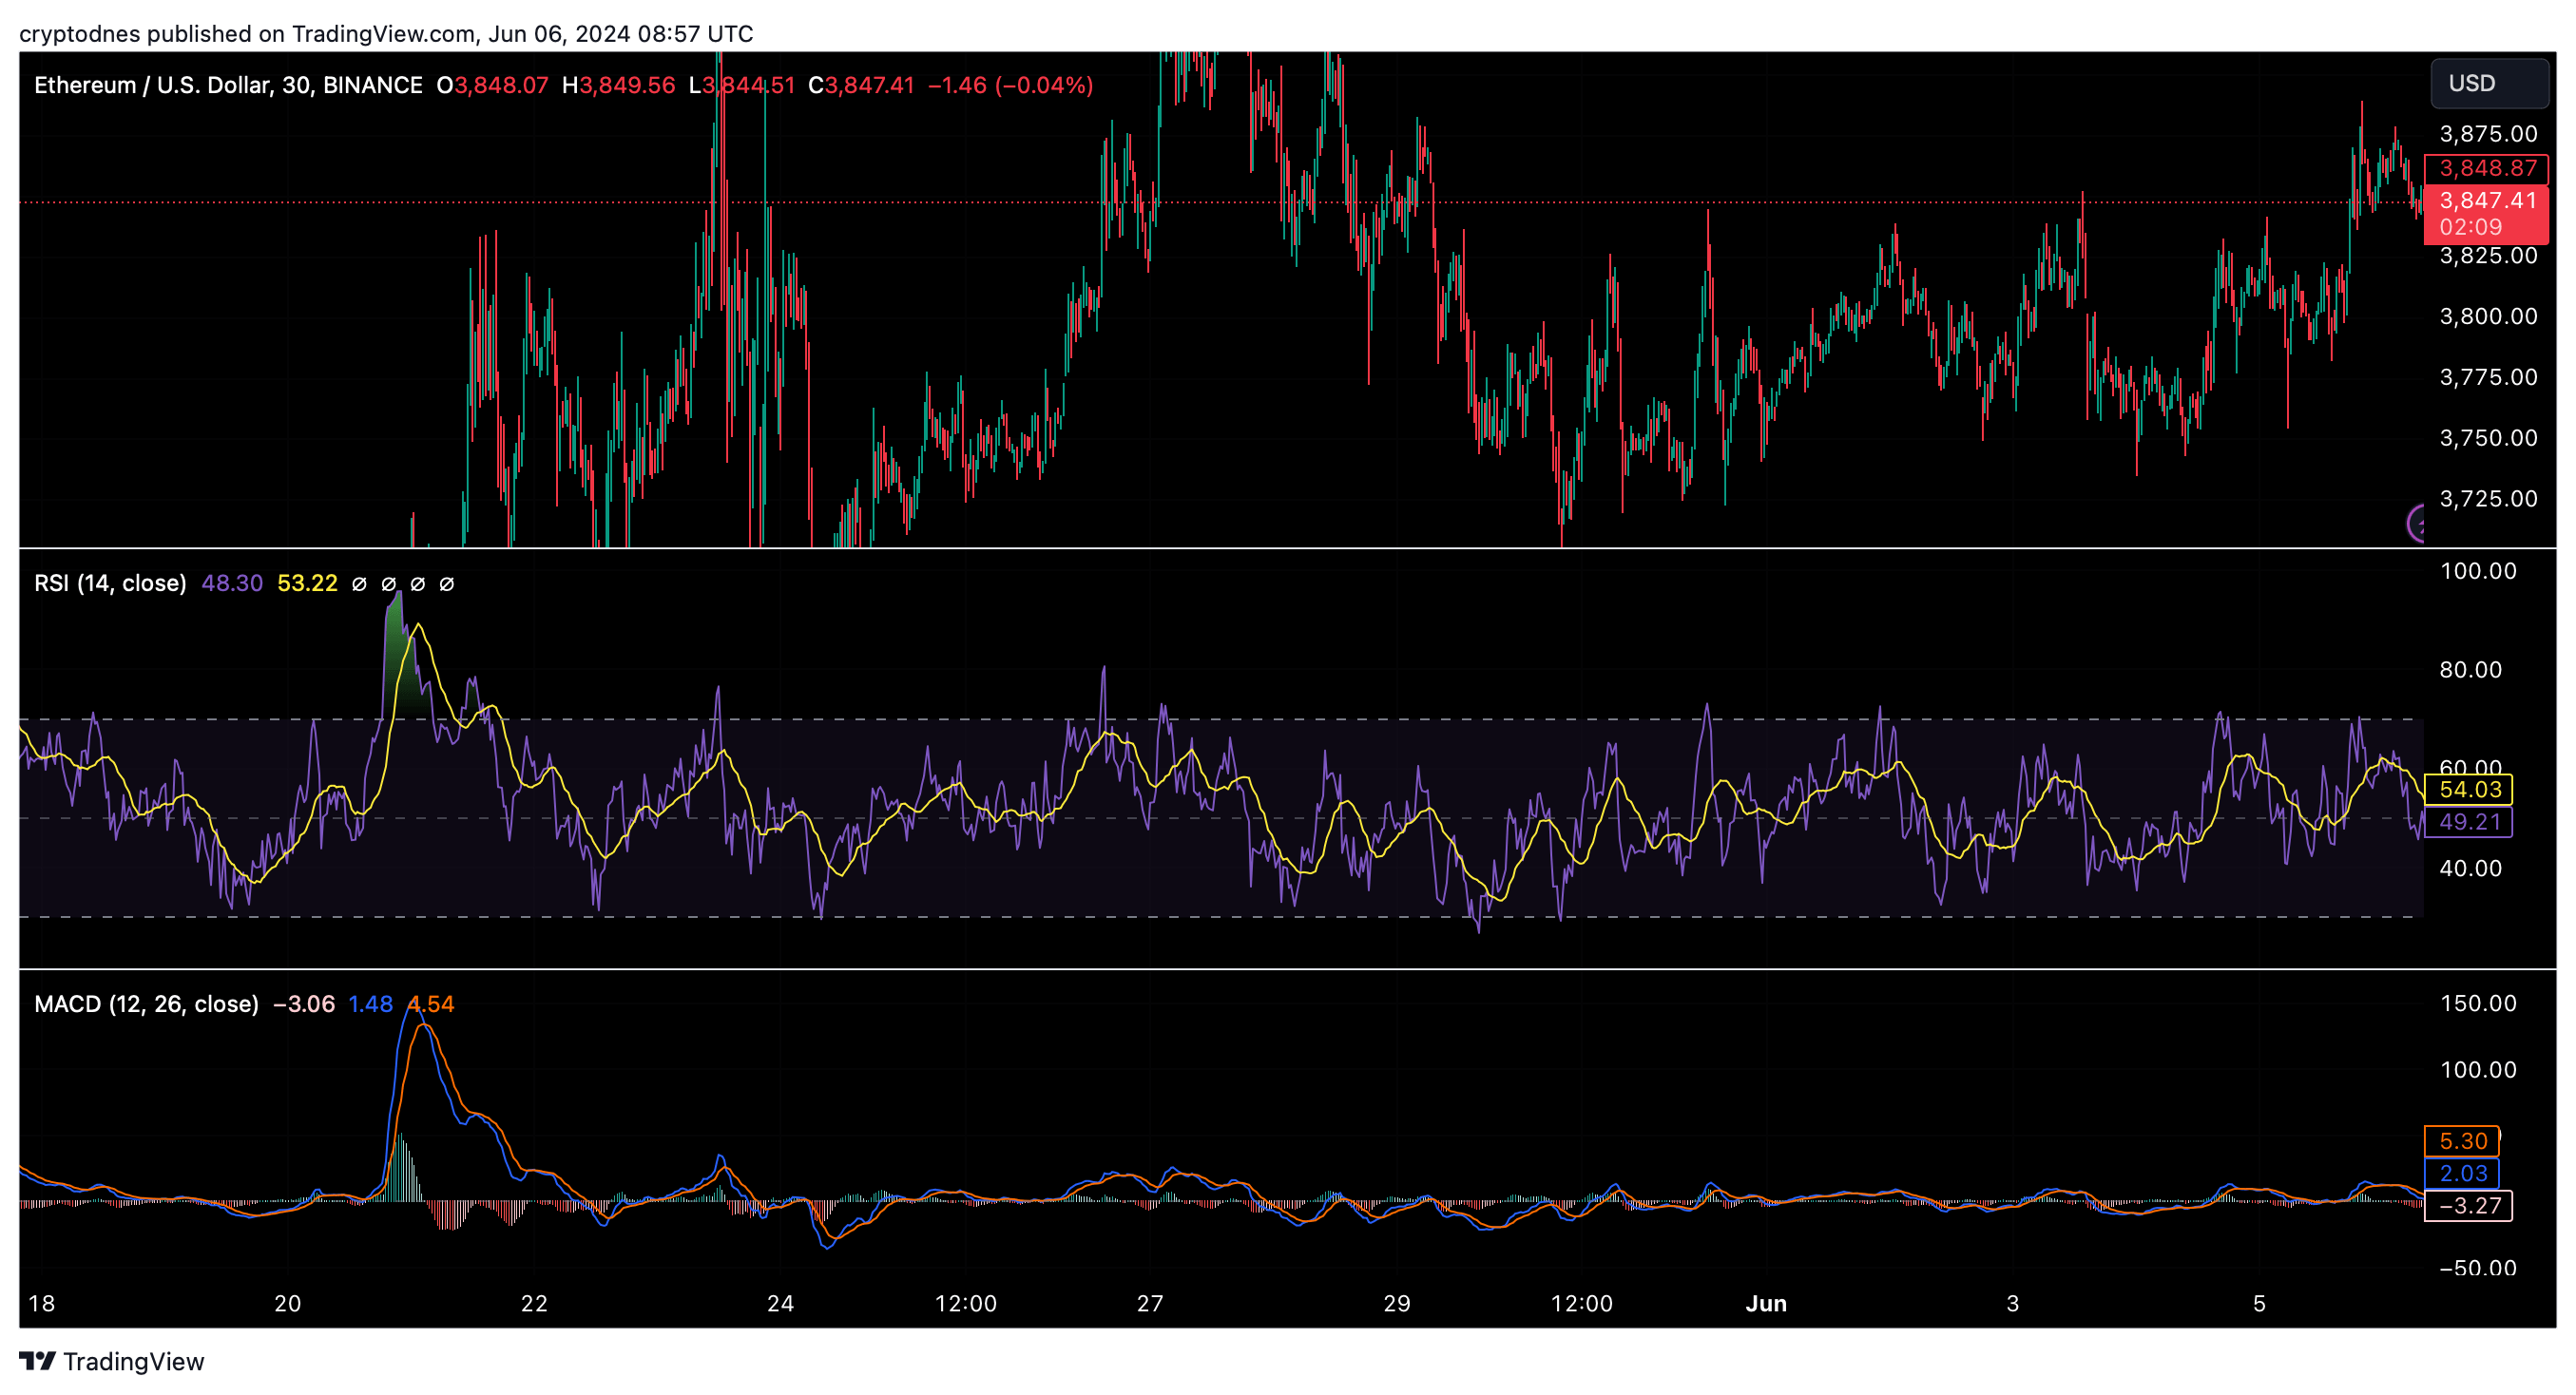
Following Bitcoin’s appreciation, the price of Ethereum has started to improve and is currently trading at $3,844, with a 1% weekly and 3% monthly increase from the previous day and week, respectively.
Both the simple and exponential moving averages indicate that Ethereum is in the buy zone, signaling increased interest among investors. The Relative Strength Index (RSI) is above 50, suggesting a balance between buying and selling pressure, which may help stabilize the price of Ethereum at current levels.
Additionally, options volume for ETH has surpassed that of Bitcoin, according to reports from QCP Capital, a Singapore-based trading firm, indicating further bullish potential for Ethereum.
However, there are concerns about the declining volume of Ethereum on decentralized exchanges (DEX), which has dropped by $2 billion in the past week. This decline raises doubts about demand for Ethereum.
Looking ahead, indicators such as the moving average convergence divergence (MACD) and momentum one point to increased selling pressure on Ethereum, suggesting potential fluctuations before a price recovery.

More from Ethereum Analysis
Ethereum Gears up for Breakout, but Resistance Zone Poses Short-term Risk
Ethereum may be on the verge of replicating Bitcoin’s legendary 2020 surge, according to crypto analyst. His latest chart comparison shows ETH following a nearly identical structure to BTC’s pre-breakout phase — including a red resistance line, a sharp mid-cycle shakeout, and a re-accumulation period. “Same structure. Same brutal shakeout. Same explosive breakout ahead,” Merlijn […]
Ethereum Builds Momentum With Bullish Chart: What could Be Next?
Ethereum (ETH) is gaining serious traction across technical, on-chain, and performance metrics—fueling speculation that a major breakout could be underway. With analysts targeting price levels as high as $6,700 by 2025, the case for Ethereum’s strength continues to grow. Bullish chart signals suggest $6,700 in sight Crypto analyst Titan of Crypto has identified a powerful […]
Ethereum Breaks Out After Pectra Upgrade — Is a Bigger Rally Brewing?
After months of sluggish performance, the second-largest cryptocurrency posted weekly gains above 30%, reclaiming key price levels and setting off a wave of liquidations across the market. Market veteran Peter Brandt has taken notice. In his latest technical review, he points to a long-brewing bullish formation — an ascending triangle — that stretches back several […]
Ethereum Flips the Script After Pectra Upgrade, Outpaces Bitcoin
Over the last two days, ETH has outperformed not only Bitcoin but most of the top digital assets, fueled by technical momentum and a successful network upgrade. A key driver behind the surge is Ethereum’s breakout against Bitcoin, where bullish formations have emerged on short-term charts—specifically, golden crosses that often hint at trend reversals. These […]
Popular News
-
1
Ethereum Builds Momentum With Bullish Chart: What could Be Next?
20.07.2025 16:00 2 min. read -
2
Ethereum Gears up for Breakout, but Resistance Zone Poses Short-term Risk
26.07.2025 9:30 2 min. read -
3
Ethereum’s Uncertainty Grows as Solana Solidifies Its Dominance
22.11.2024 17:00 1 min. read -
4
Ethereum: $2,500 the Bears’ Next Target?
14.05.2024 18:30 2 min. read -
5
What Technical Indicators Show About the Price of Ethereum
06.06.2024 12:00 2 min. read