Bitcoin and Crypto Market Performance in Q2 2024
We may earn commissions from affiliate links or include sponsored content, clearly labeled as such. These partnerships do not influence our editorial independence or the accuracy of our reporting. By continuing to use the site you agree to our terms and conditions and privacy policy.


Blockchain analytics platform Glassnode, collaboratng with Coinbase, the largest cryptocurrency exchange in the U.S., released their "Guide to Crypto Markets for Q3 2024."
The collaborative guide aims to enhance investors’ comprehension of crypto markets. It offers an in-depth analysis of key metrics and trends that are particularly relevant to institutional investors. Now, let’s take a look at the numbers.
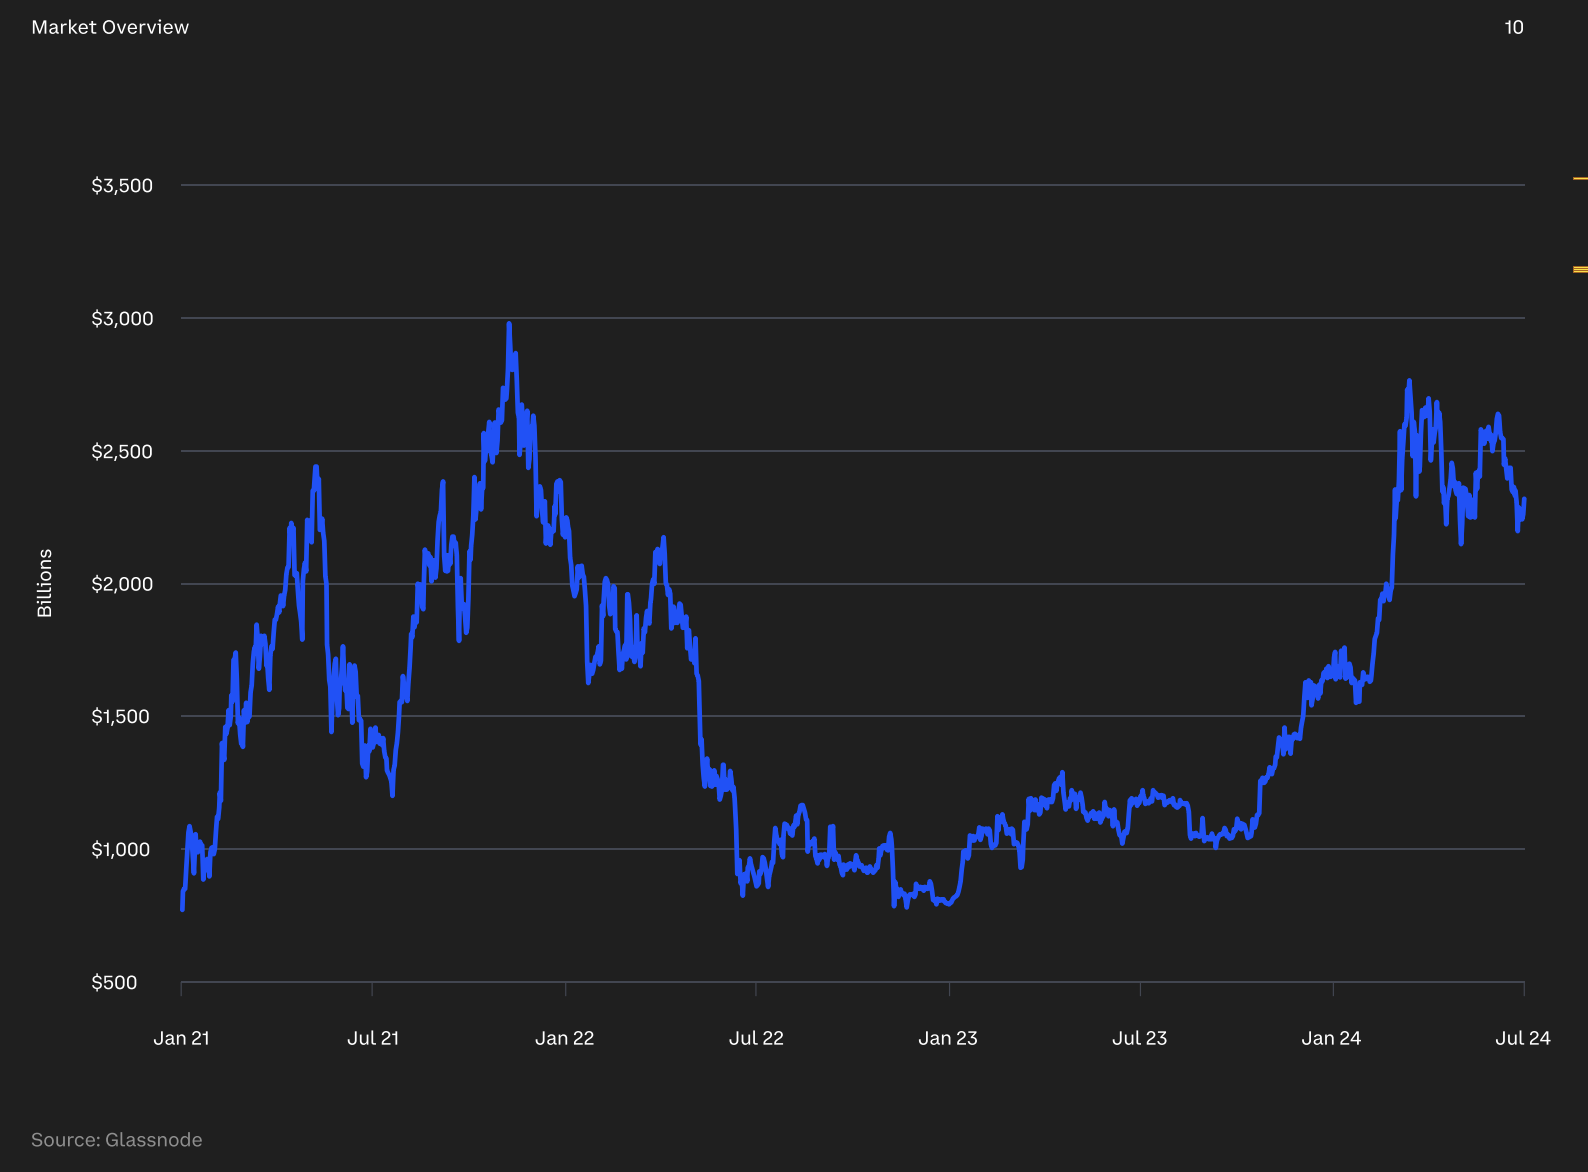
Total Market Cap
In the second quarter of 2024, the cryptocurrency market experienced a significant downturn, with the total market capitalization declining by 14%.
Crypto Dominance
This follows a remarkable 60% increase in the previous quarter, reflecting a notable shift in market dynamics.
During Q2, the dominance of Bitcoin (BTC), Ethereum (ETH), and stablecoins saw modest increases, while altcoin dominance decreased by 27%.
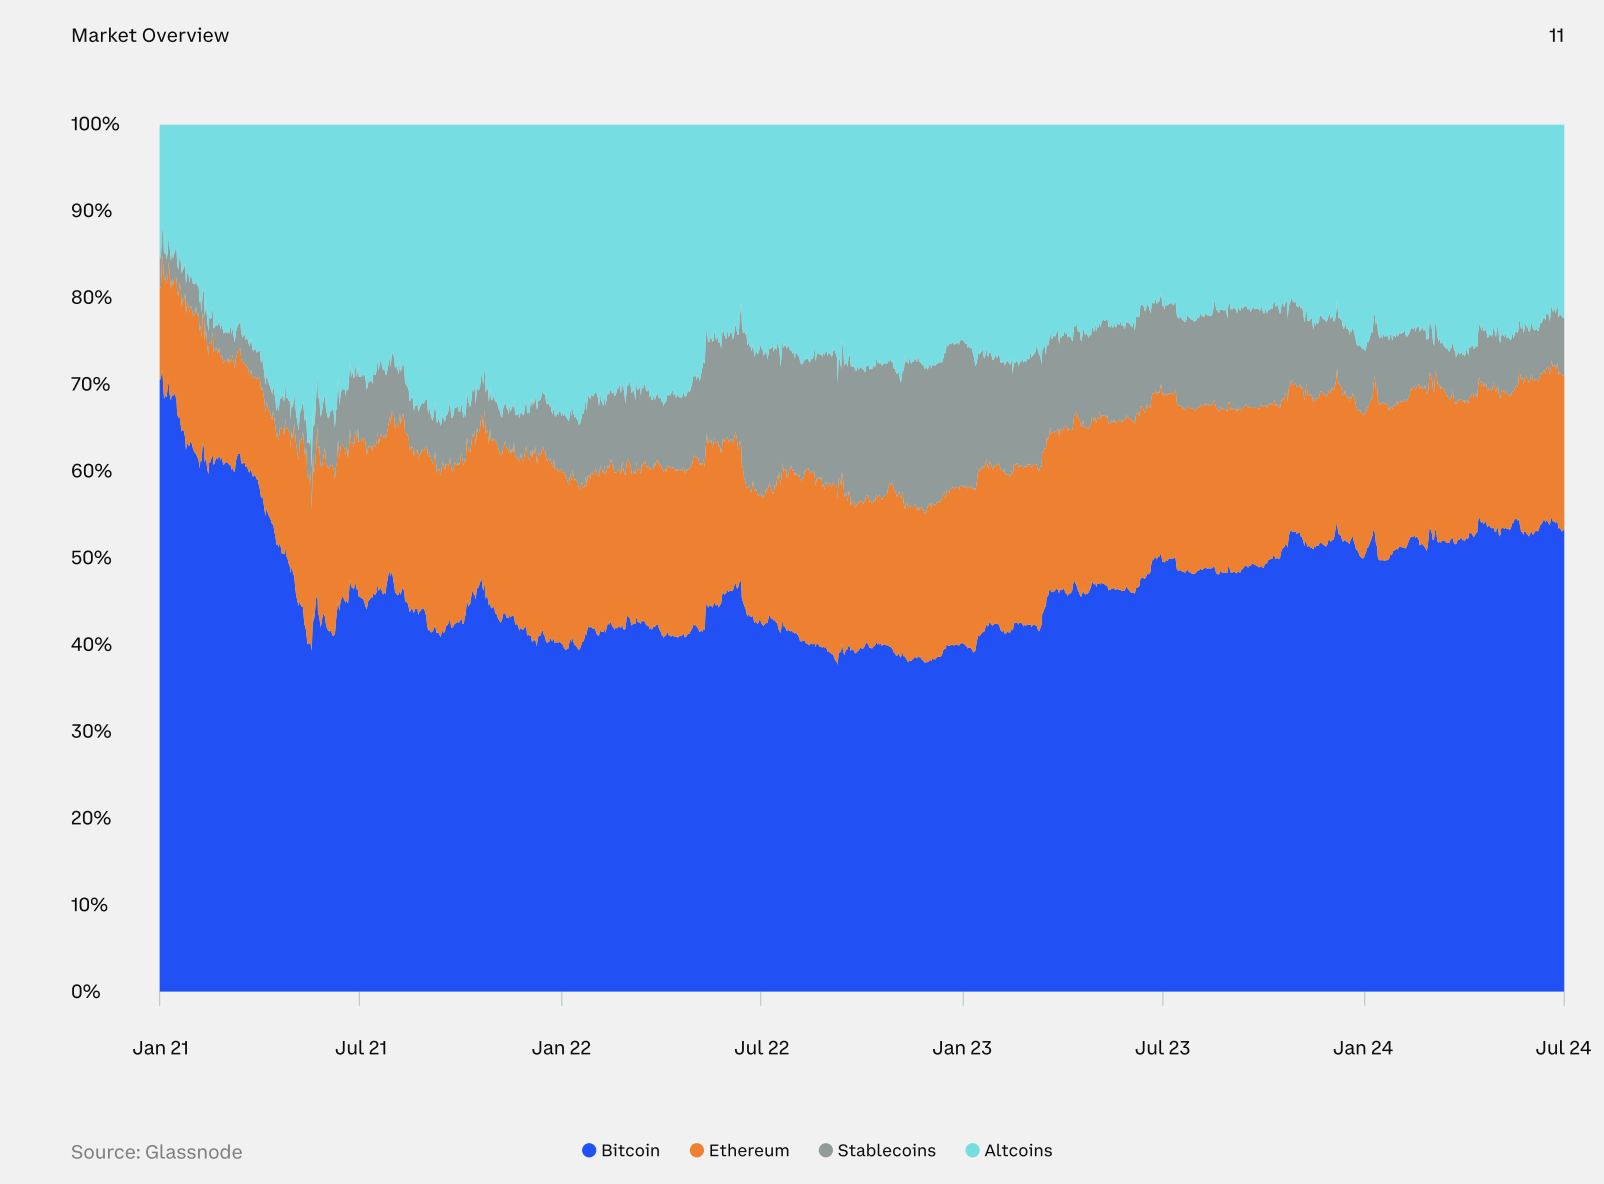
This shift indicates that investors are gravitating towards more established and higher-quality assets, moving away from smaller, less proven altcoins.
Read More:
Stablecoin Supply
The supply of stablecoins grew by 6% in the second quarter, highlighting their expanding role and various applications within the crypto ecosystem.
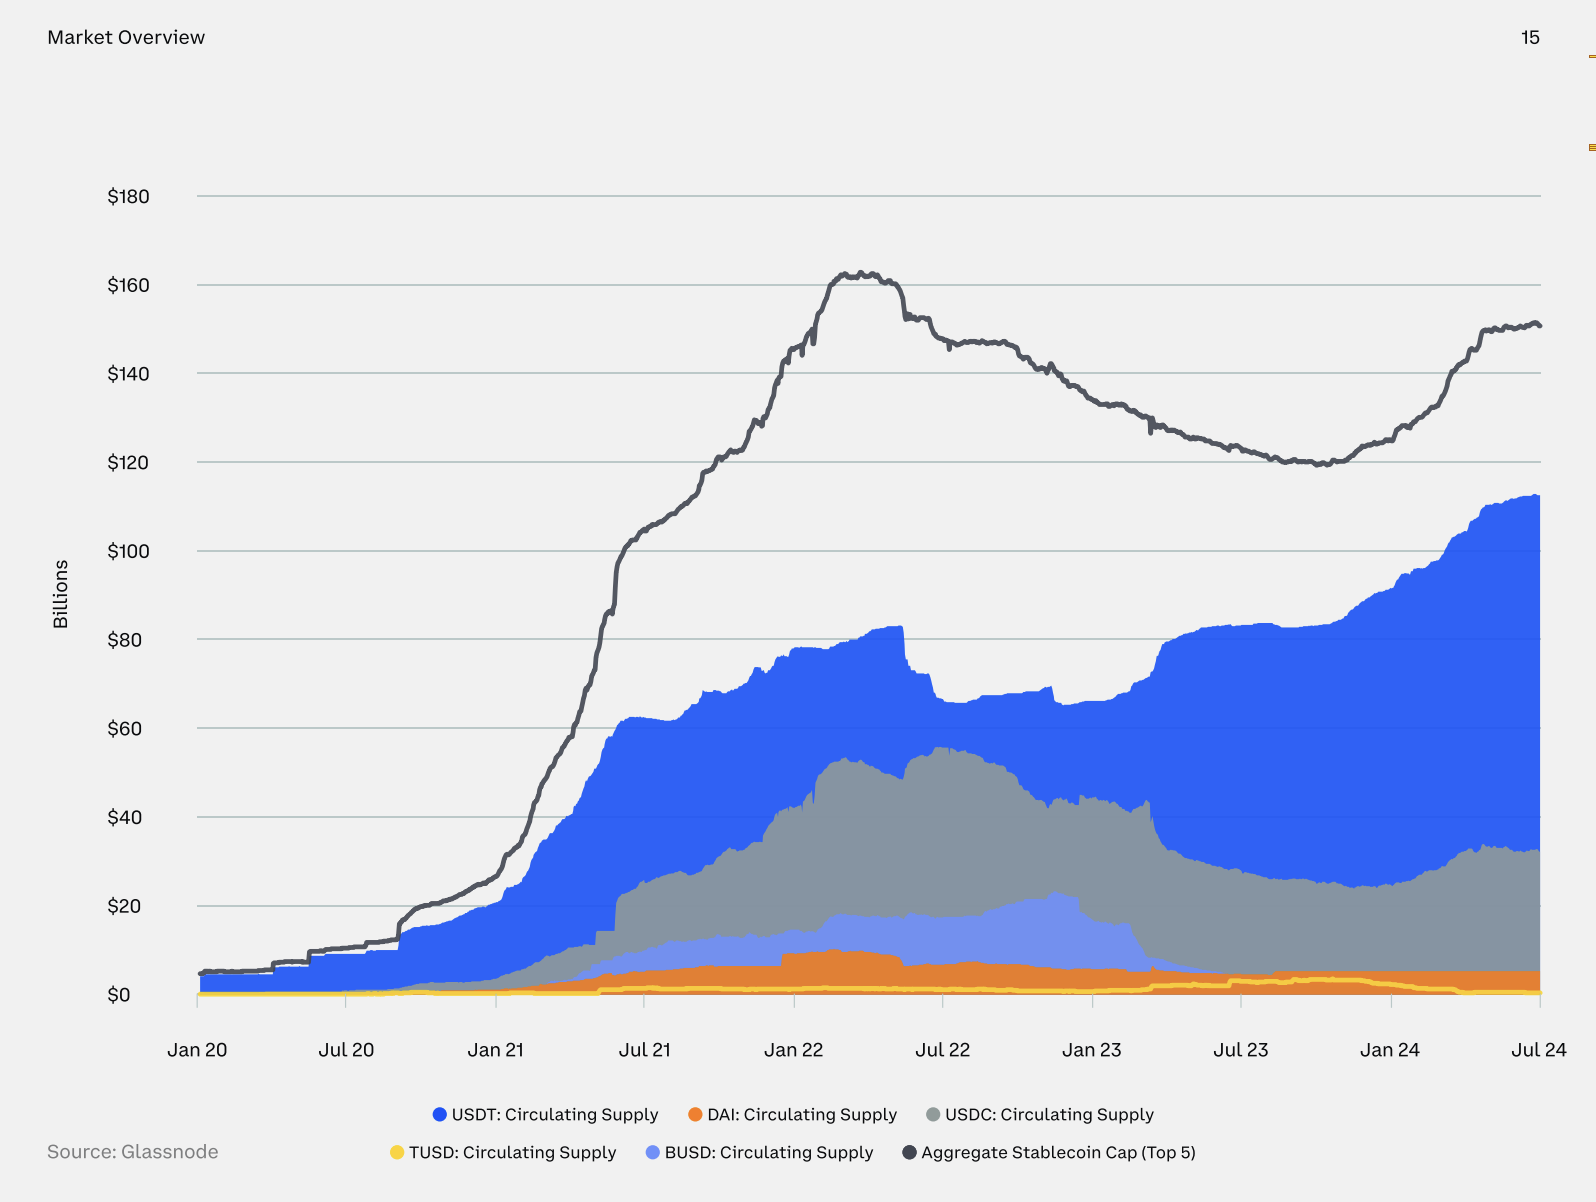
Despite the overall market contraction, the use and circulation of stablecoins continue to rise.
Stablecoin Velocity
Stablecoin velocity, which measures the frequency of transactions relative to market capitalization, approached 0.2 during this period.
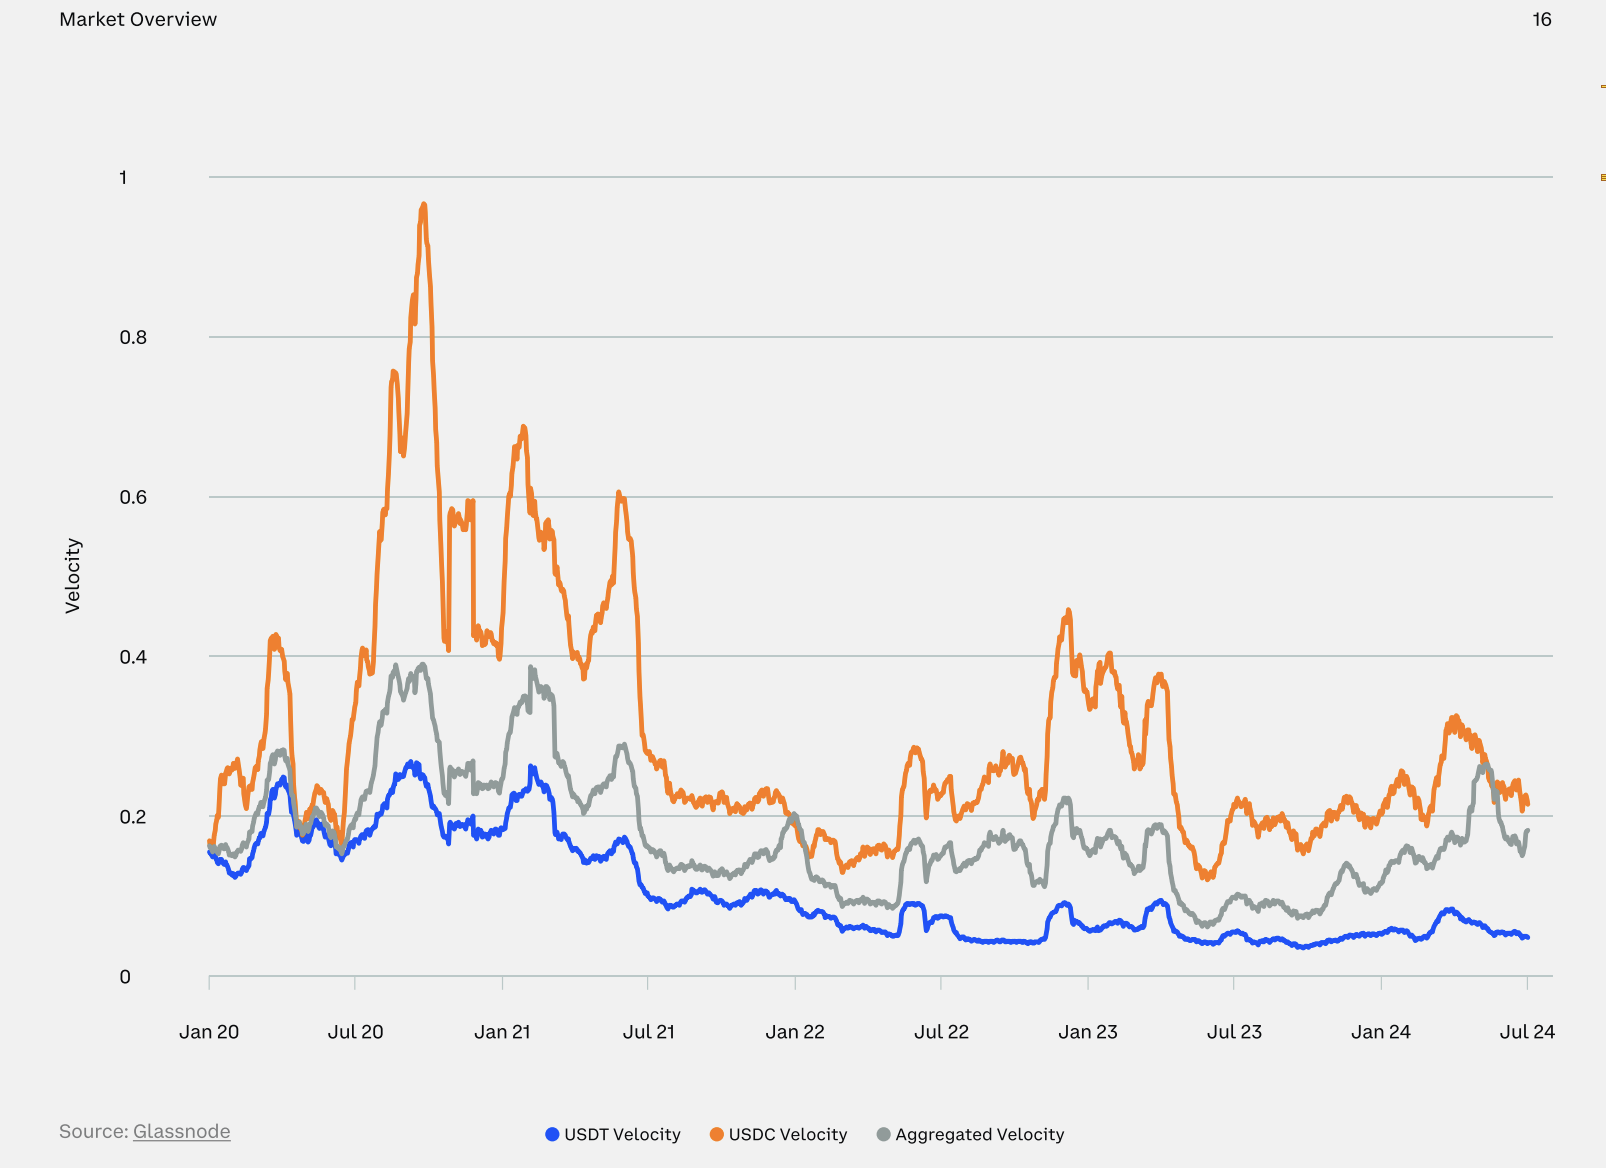
This means that approximately 20% of the total stablecoin supply was actively transacting on a daily basis, underscoring their increased utility and integration into the market.
BTC Price and Market Cap
After a remarkable 70% surge in the first quarter, driven by unprecedented demand for ETFs, Bitcoin prices declined by 12% in the second quarter.
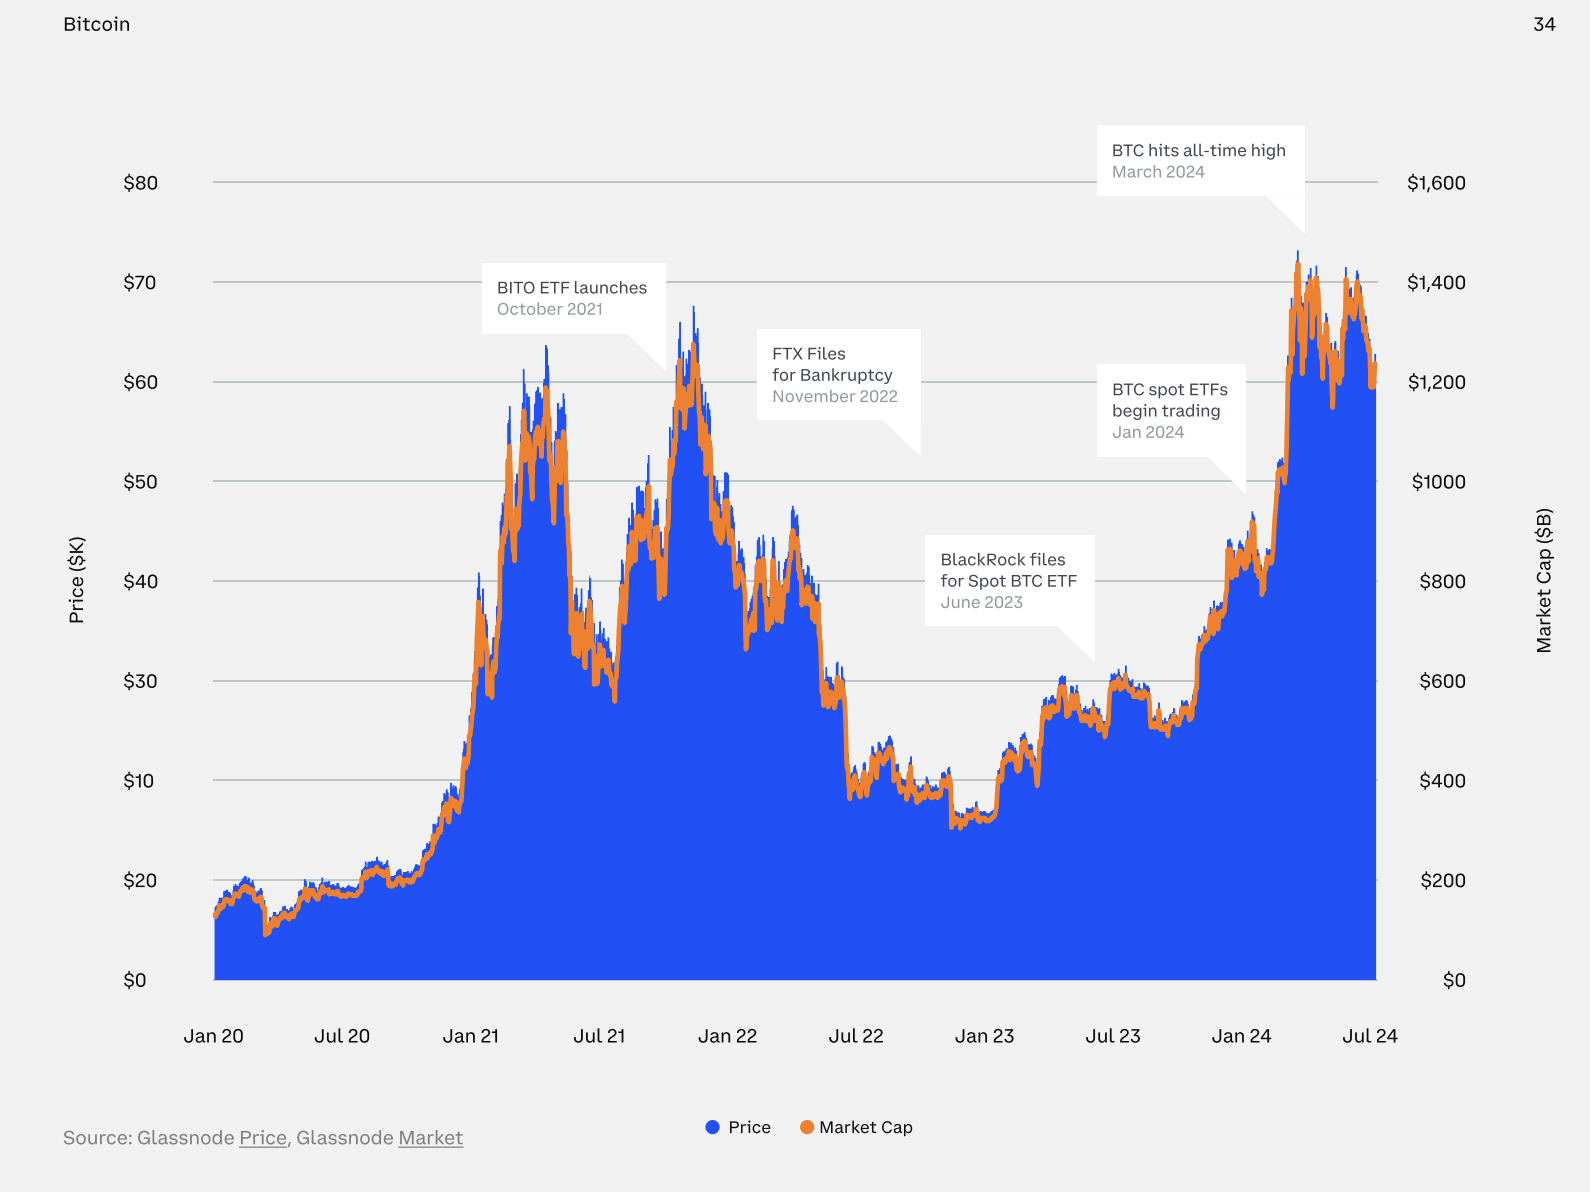
This downturn marked a shift from the exuberant gains earlier in the year.
Daily Active Addresses
The number of unique addresses active in the Bitcoin network, either as senders or receivers, serves as a crucial indicator of user adoption, network health, and economic activity.
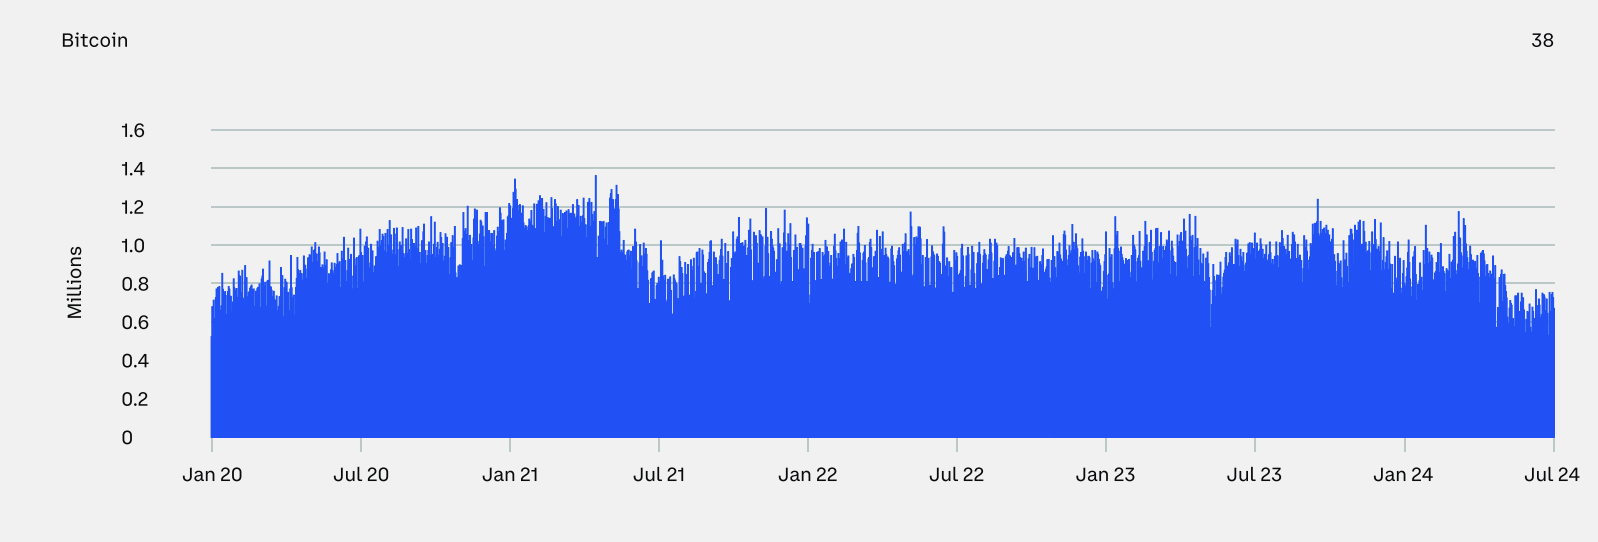
In the second quarter, the average number of daily active addresses dropped by 20%, signaling a decrease in network engagement.

Daily Active Entities
Beyond active addresses, the number of active entities—clusters of addresses controlled by the same network entity—provides further insight.
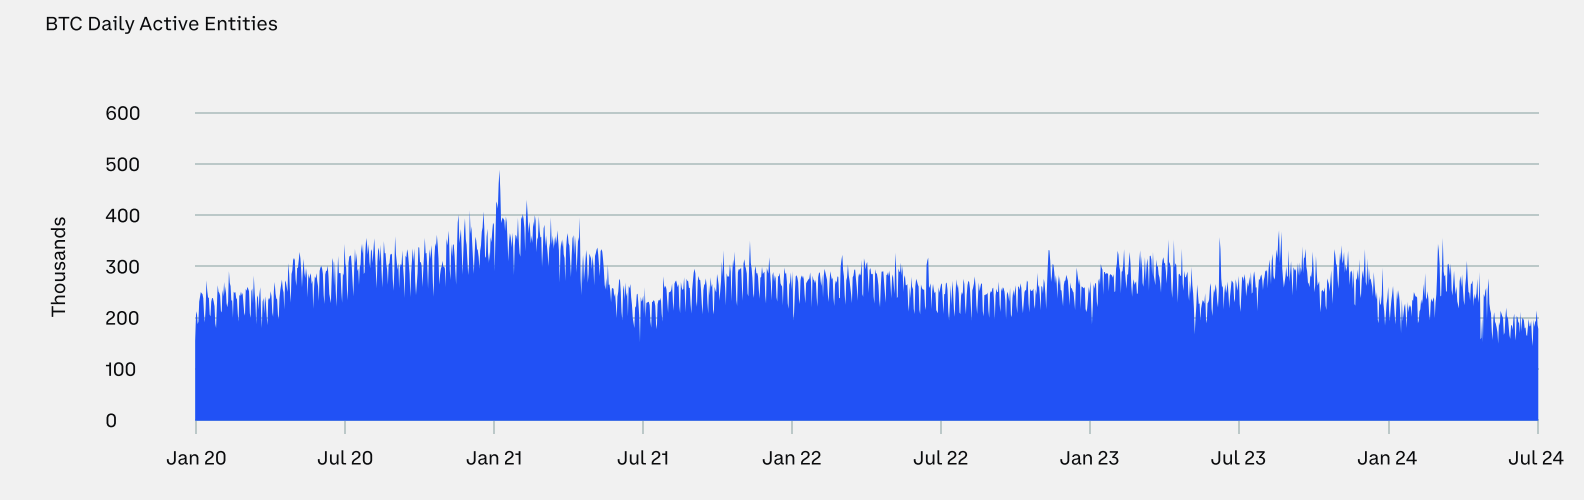
This metric, estimated using advanced heuristics and proprietary clustering algorithms by Glassnode, revealed a 16% decline in the average number of daily active entities during the second quarter. This decrease suggests a reduction in overall network activity and engagement.
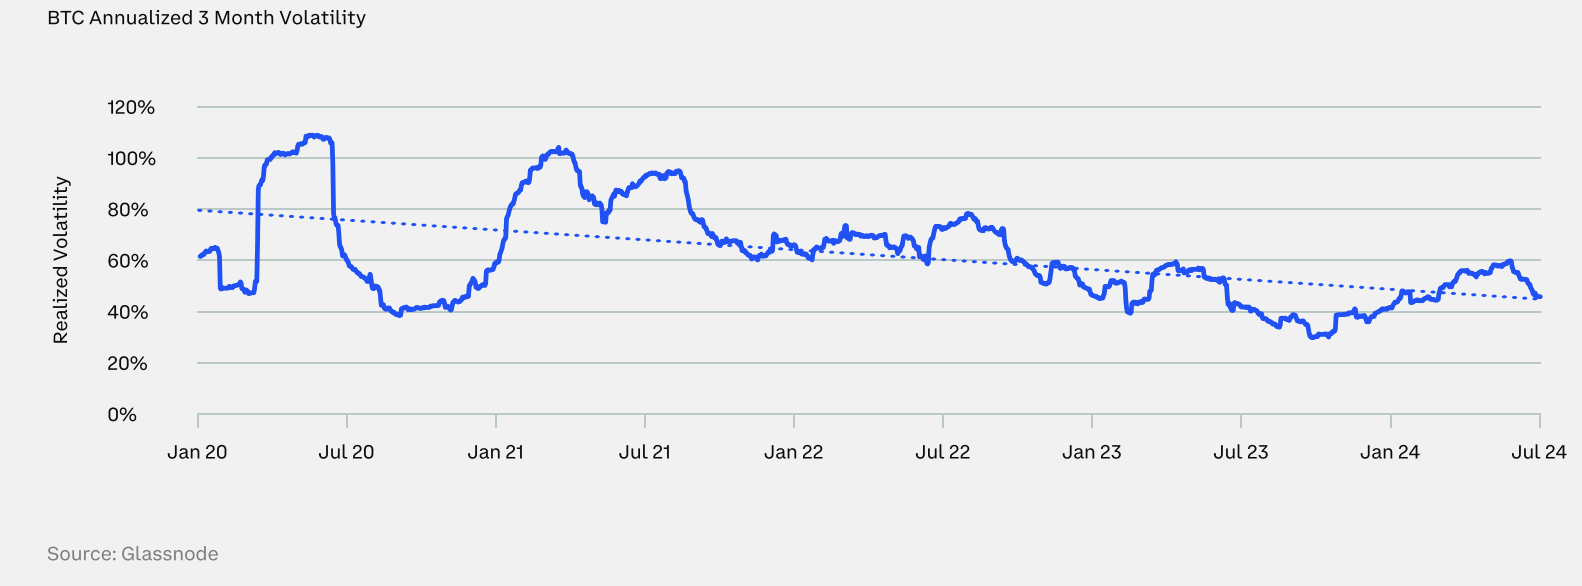
Volatility
Bitcoin’s volatility, which had increased by 35% in the first quarter as prices hit an all-time high and then retracted, fell by 18% in the second quarter. This reduction in volatility indicates that Bitcoin settled into a more stable trading range during this period.
Conclusion
Overall, Q2 2024 saw a cooling off in the cryptocurrency market, with Bitcoin experiencing declines in price, active addresses, and entities, along with reduced volatility, reflecting a period of consolidation following significant gains in the first quarter.
Currently, Bitcoin is trading at $64,500 after a 3.4% decline in the past 24 hours and recorded $36.2 billion in volume.


Fill in necessary fields and publish