


加密貨幣屬於高風險資產類別,投資涉及重大風險,包括可能損失部分或全部投資。本網站資訊僅供參考及教育之用,不構成財務、投資或交易建議。如需了解更多詳情,請閱讀我們的編輯政策。
What Technical Indicators Show About the Price of Ethereum
6 6 月, 2024 12:00 2 閱讀分鐘
Despite the approval of the Ethereum ETF, the ETH price has remained stagnant over the past two weeks, hovering between $3,700 and $3,840.
This lack of movement raises questions about Ethereum’s impact on the market, especially when compared to the bullish trends seen in other cryptocurrencies.
However, technical factors suggest a potential rally for Ethereum in the near future. Market sentiment appears bullish, as indicated by fear and greed indices reflecting rising demand.
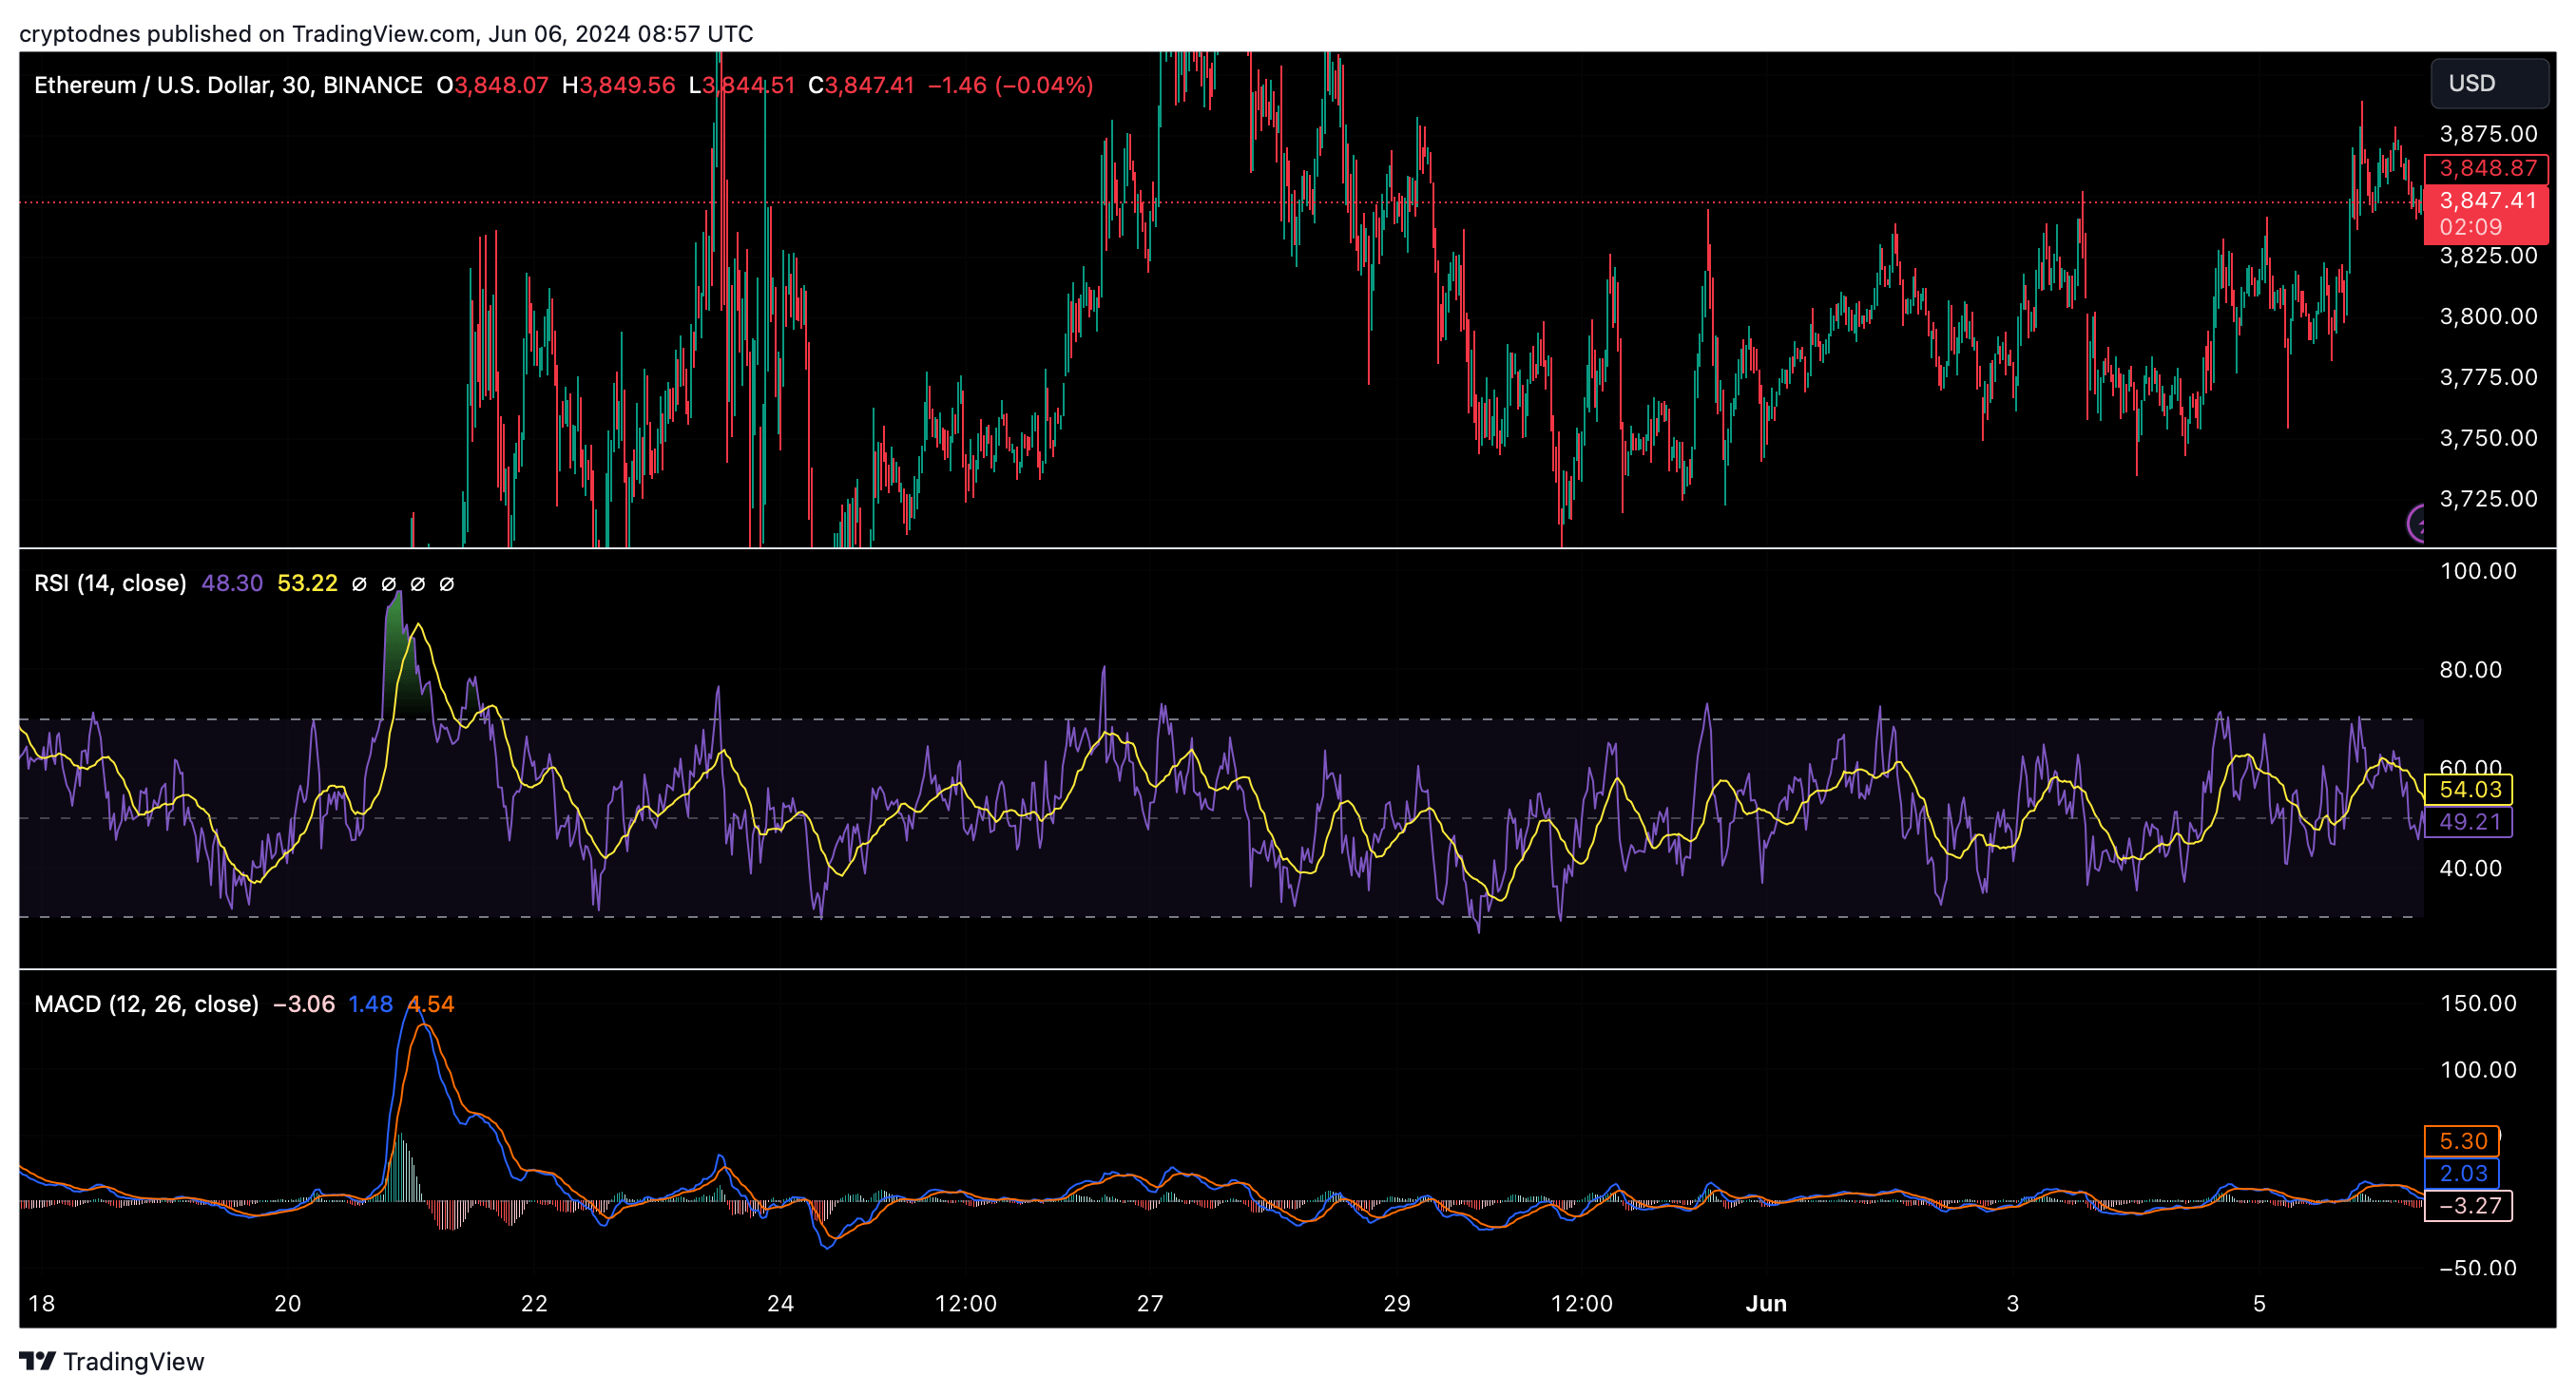
Following Bitcoin’s appreciation, the price of Ethereum has started to improve and is currently trading at $3,844, with a 1% weekly and 3% monthly increase from the previous day and week, respectively.
Both the simple and exponential moving averages indicate that Ethereum is in the buy zone, signaling increased interest among investors. The Relative Strength Index (RSI) is above 50, suggesting a balance between buying and selling pressure, which may help stabilize the price of Ethereum at current levels.
Additionally, options volume for ETH has surpassed that of Bitcoin, according to reports from QCP Capital, a Singapore-based trading firm, indicating further bullish potential for Ethereum.
However, there are concerns about the declining volume of Ethereum on decentralized exchanges (DEX), which has dropped by $2 billion in the past week. This decline raises doubts about demand for Ethereum.
Looking ahead, indicators such as the moving average convergence divergence (MACD) and momentum one point to increased selling pressure on Ethereum, suggesting potential fluctuations before a price recovery.

更多 Ethereum 分析
以太坊價格預測: 分析師確認市場修正中的看跌趨勢
以太坊 近期的市場表現引起了分析師的警覺。ETH 從 10 月份的 2,400 美元開始,到 11 月份達到 […]
Ethereum (ETH) Price Struggles With Key Resistance Levels
Recently, Ethereum failed to overcome the $2,450 resist […]
Ethereum Crash Alert: Analyst Predicts Potential Drop Below $1,200
Crypto analyst Benjamin Cowen has shared a cautious out […]
Ethereum: $2,500 the Bears’ Next Target?
Ethereum (ETH) has been in a downtrend since falling be […]
Popular News
-
1
以太坊價格預測: 分析師確認市場修正中的看跌趨勢
01.11.2024 21:00 1 閱讀分鐘 -
2
Ethereum: $2,500 the Bears’ Next Target?
14.05.2024 18:30 2 閱讀分鐘 -
3
What Technical Indicators Show About the Price of Ethereum
06.06.2024 12:00 2 閱讀分鐘 -
4
Ethereum Crash Alert: Analyst Predicts Potential Drop Below $1,200
05.09.2024 13:30 1 閱讀分鐘 -
5
Ethereum (ETH) Price Struggles With Key Resistance Levels
17.09.2024 19:00 1 閱讀分鐘