


Bitcoin’s Next Moves: Analyst Reveals Key Support and Resistance Levels
02.08.2024 18:00 1 min. read Alexander Stefanov
On August 1, Bitcoin (BTC) fell to below $63,000, marking its lowest level in more than two weeks.
This decline is related to lowered expectations of a US interest rate cut and the distribution of over 47,000 BTC from the defunct Mt. Gox exchange.
Traders are now watching key support and resistance levels to identify potential buying opportunities.
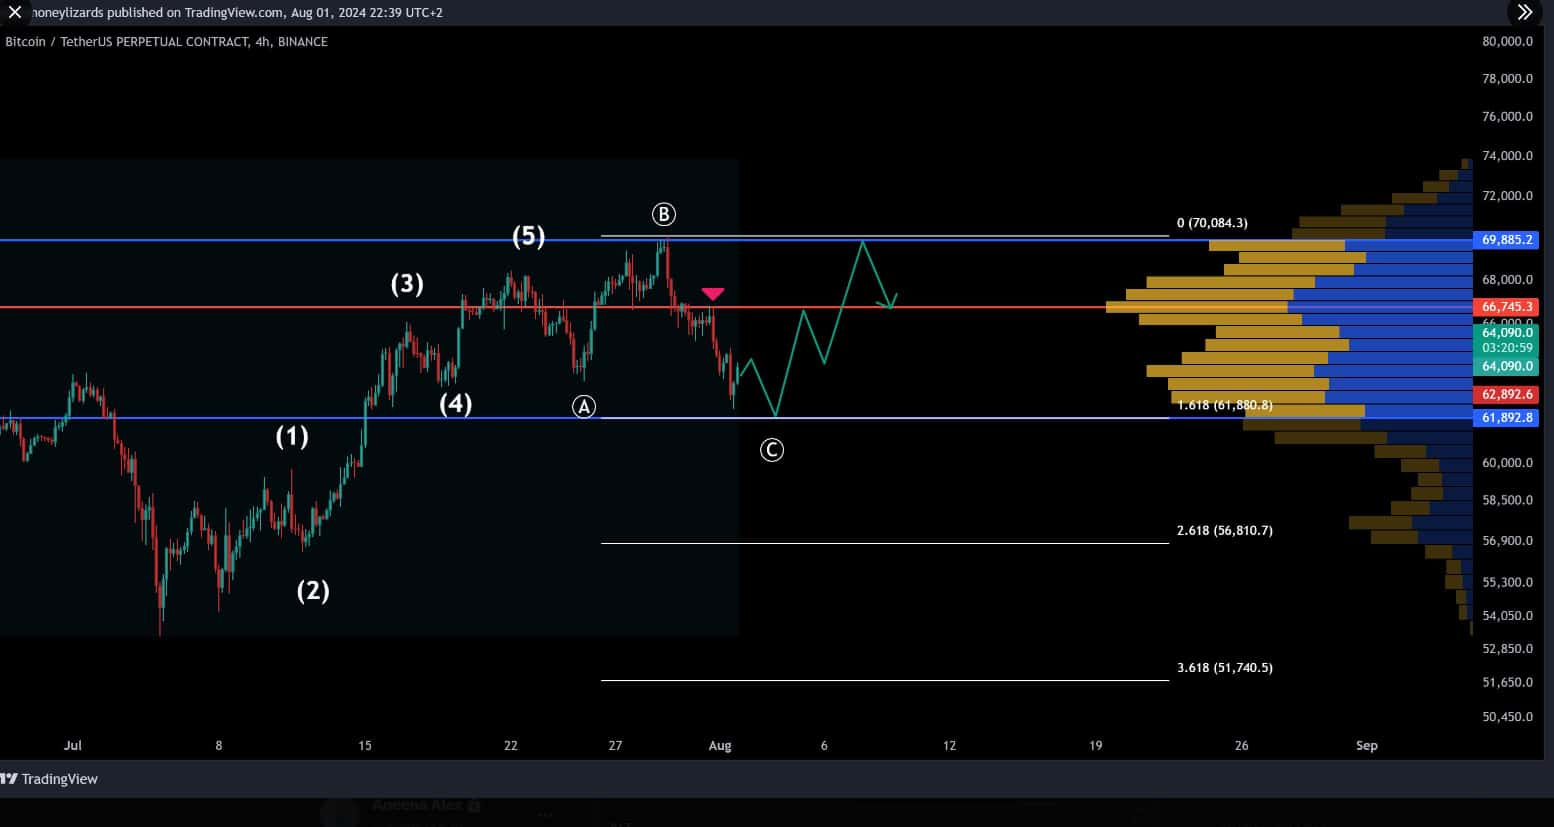
Analyst Stockmoney Lizards notes that Bitcoin is approaching a critical point, representing a potential entry point for investors. His technical analysis highlights a classic 5-wave uptrend, followed by an ABC retracement on the 4-hour chart, indicating a typical Elliott wave pattern.

Key Support and Resistance Zones
Support levels
The immediate buy zone is set between $61,880 and $62,300. A bounce from this range could signal a continuation of the uptrend. If this support fails, the next significant level to watch is around $56,810.
Resistance levels
On the upside, Bitcoin faces resistance at $66,745. A break above this level, on strong trading volume, could indicate the next buying opportunity. The top of the value zone at $69,885 also remains a key resistance point.


-
1
Bitcoin: What to Expect After Hitting a New All-time High
10.07.2025 14:00 2 min. read -
2
Peter Brandt Issues Cautious Bitcoin Warning Despite Bullish Positioning
10.07.2025 20:00 2 min. read -
3
Standard Chartered Becomes First Global Bank to Launch Bitcoin and Ethereum Spot Trading
15.07.2025 11:00 1 min. read -
4
Vanguard Now Owns 8% of Michael Saylor’s Strategy, Despite Calling BTC ‘Worthless’
15.07.2025 17:09 2 min. read -
5
What’s The Real Reason Behind Bitcoin’s Surge? Analyst Company Explains
12.07.2025 12:00 2 min. read
Global Money Flow Rising: Bitcoin Price Mirrors Every Move
Bitcoin is once again mirroring global liquidity trends—and that could have major implications in the days ahead.
What is The Market Mood Right Now? A Look at Crypto Sentiment And Signals
The crypto market is showing signs of cautious optimism. While prices remain elevated, sentiment indicators and trading activity suggest investors are stepping back to reassess risks rather than diving in further.
What Price Bitcoin Could Reach If ETF Demand Grows, According to Citi
Citigroup analysts say the key to Bitcoin’s future isn’t mining cycles or halving math—it’s ETF inflows.
Is Bitcoin’s Summer Slowdown a Buying Opportunity?
Bitcoin may be entering a typical summer correction phase, according to a July 25 report by crypto financial services firm Matrixport.
-
1
Bitcoin: What to Expect After Hitting a New All-time High
10.07.2025 14:00 2 min. read -
2
Peter Brandt Issues Cautious Bitcoin Warning Despite Bullish Positioning
10.07.2025 20:00 2 min. read -
3
Standard Chartered Becomes First Global Bank to Launch Bitcoin and Ethereum Spot Trading
15.07.2025 11:00 1 min. read -
4
Vanguard Now Owns 8% of Michael Saylor’s Strategy, Despite Calling BTC ‘Worthless’
15.07.2025 17:09 2 min. read -
5
What’s The Real Reason Behind Bitcoin’s Surge? Analyst Company Explains
12.07.2025 12:00 2 min. read