Bitcoin: Is the Cycle Top In and How to Spot It?
We may earn commissions from affiliate links or include sponsored content, clearly labeled as such. These partnerships do not influence our editorial independence or the accuracy of our reporting. By continuing to use the site you agree to our terms and conditions and privacy policy.


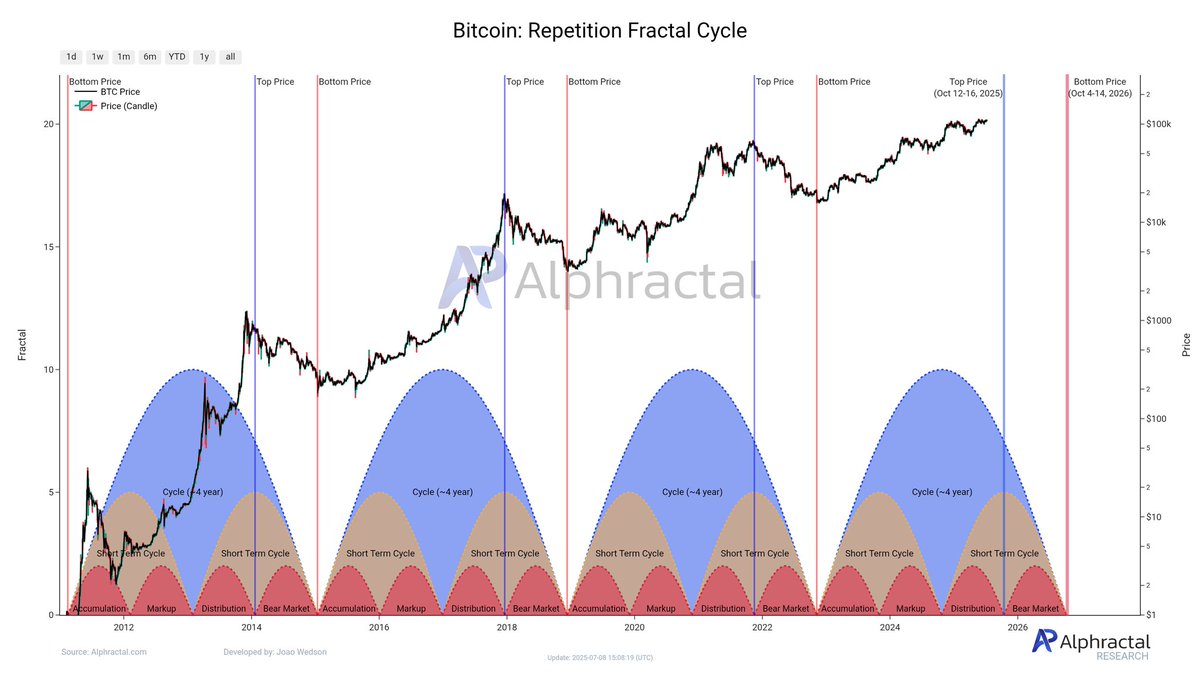
Bitcoin may not have reached its peak in the current market cycle, according to a recent analysis by crypto analytics firm Alphractal.
The firm points to its Repetition Fractal Cycle model—a metric it says has consistently timed Bitcoin’s tops and bottoms since 2015—with remarkable precision.
Analysts at Alphractal argue that, based on this fractal pattern, the current market still shows room for upward movement. “Will it repeat this time? No one knows for sure,” the firm stated, “but there’s a strong possibility.” The next few months are expected to be critical in testing the reliability of this repeating fractal structure, which has become one of the firm’s most referenced tools for long-term trend assessment.
Miners and momentum: a leading signal?
Another insight shared by Alphractal focuses on the mining sector—often seen as a key driver of Bitcoin’s price behavior. The firm points out that mining stocks, particularly Iris Energy (IREN), are now appreciating at a faster pace than Bitcoin itself. IREN’s market capitalization has surged from $1.2 billion to over $4 billion, signaling renewed investor interest in Bitcoin’s infrastructure layer.
However, Alphractal also notes a weakening correlation between mining stocks and BTC, suggesting increased volatility ahead. Since mining firms typically hold substantial reserves of Bitcoin both on-chain and through institutional vehicles, any strategic movement by these entities could influence BTC’s market direction significantly. The firm advises close monitoring of miner activity as a proxy for broader market sentiment.

How to spot a Bitcoin cycle top: insights from experts
Identifying the top of a Bitcoin cycle remains a complex task, but several indicators have proven useful historically. According to Glassnode and other leading on-chain data providers, one of the most reliable signals is the MVRV Z-Score (Market Value to Realized Value). This metric highlights when Bitcoin is significantly overvalued relative to its realized price. Historically, MVRV values above 7 have aligned with major market tops.
Another key metric is the Pi Cycle Top Indicator, developed by Philip Swift. This model compares the 111-day moving average with a 2x multiple of the 350-day moving average. Crossovers have historically coincided with BTC peaks within a few days.
Lastly, exchange inflows from long-term holders are often a red flag. When dormant coins begin to move onto exchanges, it may suggest profit-taking behavior, typically observed near cycle tops.
Combining these data-driven tools with macro trends and miner behavior can offer a more complete picture of Bitcoin’s cyclical turning points.


Fill in necessary fields and publish