


Kryptomeny predstavujú vysoko rizikovú triedu aktív a investovanie do nich so sebou nesie značné riziká, vrátane možnosti straty časti alebo celej vašej investície. Informácie uvedené na tejto webovej stránke slúžia výlučne na informačné a vzdelávacie účely a nepredstavujú finančné, investičné ani obchodné poradenstvo. Pre viac informácií si prosím prečítajte našu redakčnú politiku.
Bitcoin’s Bullish Pattern Might Be a Trap, Warns Veteran Trader
7 apríla, 2025 6:52 1 minút. čítaniaMôžeme zarábať provízie z partnerských odkazov alebo uverejňovať sponzorovaný obsah, ktorý je tak jasne označený. Tieto partnerstvá nijako neovplyvňujú našu redakčnú nezávislosť ani presnosť našich správ. Pokračovaním v používaní tejto stránky súhlasíte s našimi obchodnými podmienkami a zásadami ochrany osobných údajov.

A widely recognized bullish formation in Bitcoin’s price charts might not be as promising as it appears, warns veteran trader Peter Brandt. The cryptocurrency has developed an inverse head-and-shoulders pattern, typically seen as a sign of a potential upward reversal. However, the structure presents a complication—the neckline is sloping downward.
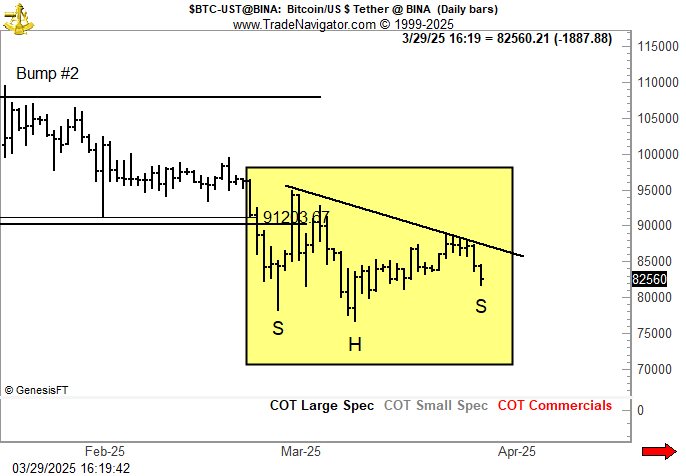
Brandt, who has spent over 40 years in commodities trading, favors head-and-shoulders formations with horizontal necklines, considering them far more dependable.
The downward angle of Bitcoin’s current setup suggests weakening buying pressure, raising the possibility that any breakout attempt could be short-lived, sending the price tumbling instead of rallying.
Trader Josh Olszewicz also pointed out the pattern on Bitcoin’s daily chart, suggesting that this may be a crucial moment for bulls to regain control. Should they fail to push the price higher, Bitcoin could slip back into the $60,000-$70,000 range.
As of now, CoinGecko data shows Bitcoin trading at $83,091, down 0.7% in the past day. The asset briefly hit an intraday low of $81,769 earlier on Sunday, struggling to regain momentum amid heightened global economic uncertainty.

Viac od
Populárne novinky